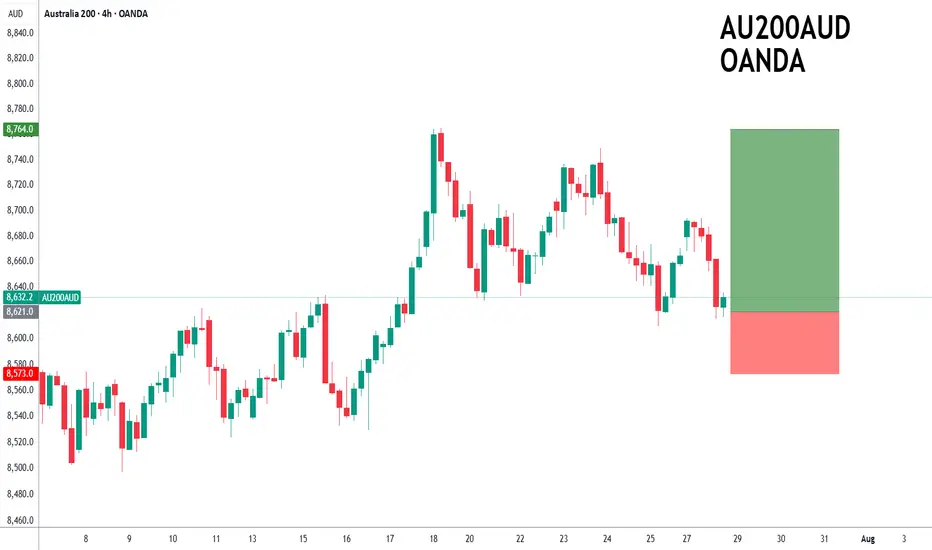
ASX200 to find support at current market price?ASX200 - 24h expiry
The primary trend remains bullish.
Price action continues to trade around the all-time highs.
20 1day EMA is at 8619.
Offers ample risk/reward to buy at the market.
Our outlook is bullish.
We look to Buy at 8621 (stop at 8573)
Our profit targets will be 8764 and 8794
Re
About S&P/ASX 200 Index
The S&P/ASX200 is an index that represents the 200 top stocks based on their weighted market capital in the Australian stock market "Australian Securities Exchange". The index represents 72% of the total market value of all the stocks traded in the Australian Securities Exchange. The trading hours for the ASX 200 index takes place from 10:00 a.m. to 4:00 p.m. Sydney time. This index was created back in 2000 and it started with a value of 3,133.3. The 2015 market capitalization of the index amounts to A$ 1.1 trillion, which sets it around the same market capitalization with some of the major indexes of Europe. The ASX200 is an indicator that gauges the performance of the Australian stock market and this indicator could be used as a guide by investors that want to understand how the biggest economy in Oceania is performing.
Related indices
AUS200/ASX200 - ANOTHER OPPORTUNITY TO SHORT AUS200Team, today, good data came out from the AUS200
The market has given some steroids
Time to put an end to this
SHORTING AUS200 at 8761 toward 8772 with stop loss at 8810
Target 1 at 8732-8726 - take 50% volume and bring stop loss to BE
TARGET 2 at 8712-8696
ENJOY YOUR DAY!
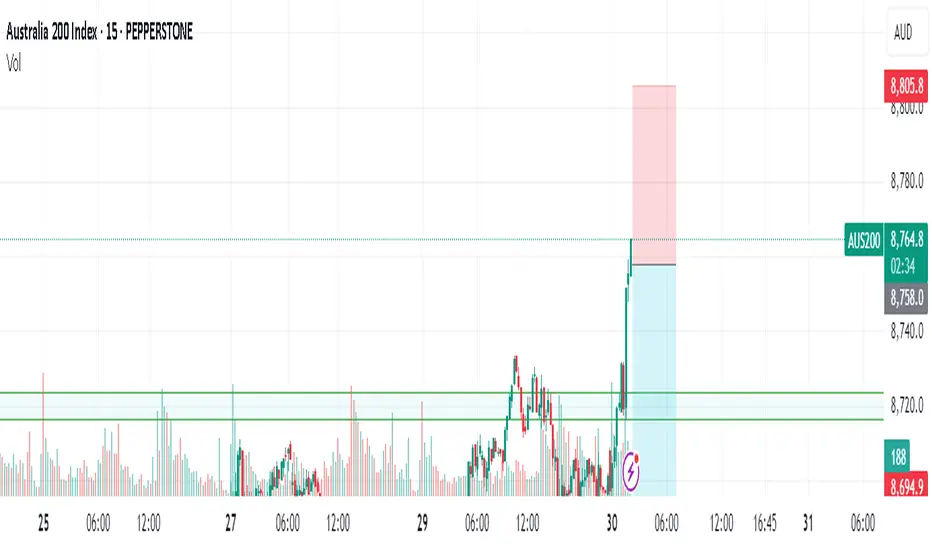
ASX200 to find buyers at current market price?ASX200 - 24h expiry
Price action resulted in a new all-time high at 8765.
Price action continues to trade around the all-time highs.
The bullish engulfing candle on the 4 hour chart the positive for sentiment.
50 4hour EMA is at 8658.
We look for a temporary move lower.
We look to Buy at 8661
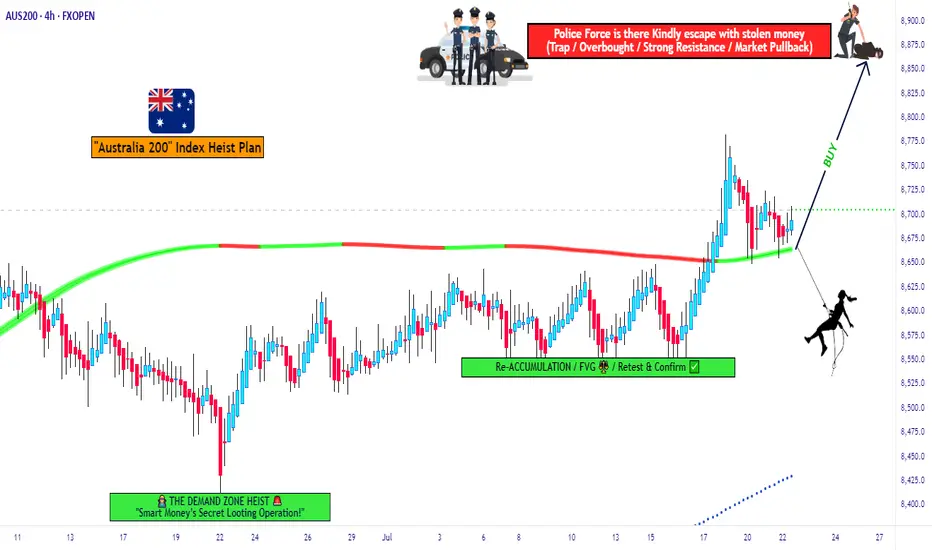
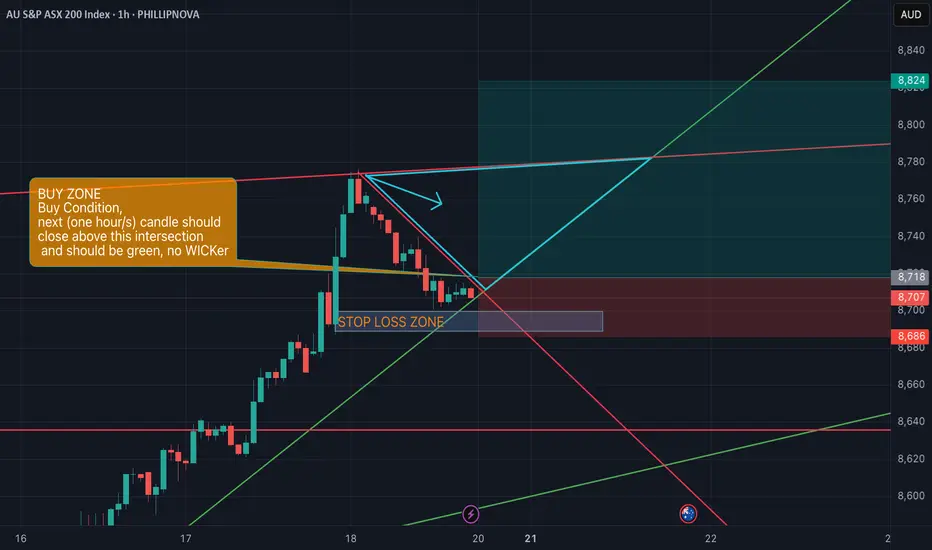
ASX200 Heist Blueprint – Entry, Exit, Escape Mapped Out!💼💣 The ASX200 Heist Blueprint: Bullish Loot Incoming! 🔥💰
🌍 Hi! Hola! Ola! Bonjour! Hallo! Marhaba! 👋
Welcome back, Money Makers & Market Robbers! 🤑💸✈️
It's time for another high-stakes heist, this time targeting the ASX200 / AUS200 “Australia 200” Index. Get your trading toolkit ready – we're plann
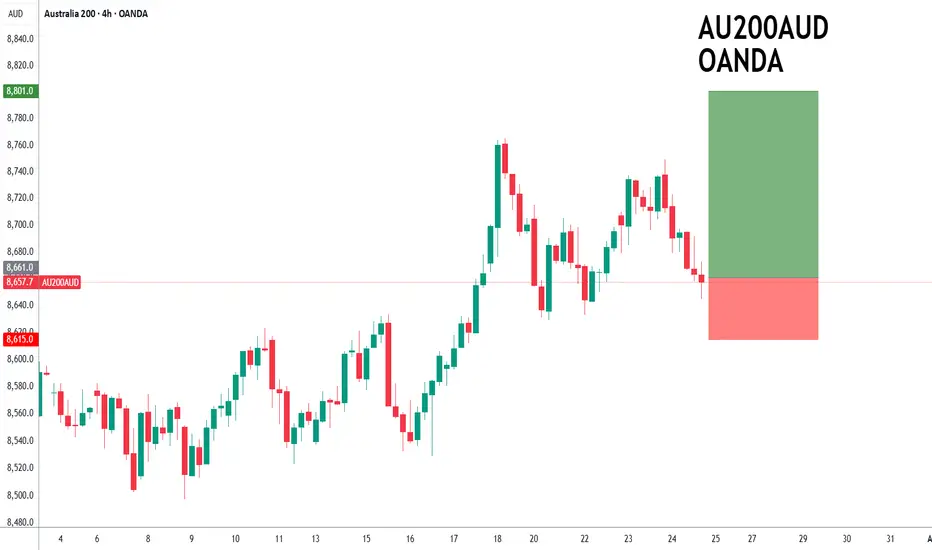
Australia 200: Pullback Presents Second Chance for LongsThe Australia 200 contract continues to trade above former horizontal resistance at 8627, with Monday’s pullback offering an improved entry level for longs looking to buy the breakout.
Bullish positions could be established ahead of 8627, with a stop beneath for protection. The session high of 8727

AUS200 Breakout or Fakeout? I Say Breakout – Here's Why🔍 Technical Overview:
After monitoring the recent movement in AUS200, I believe we are in the early phase of a bullish breakout continuation rather than a fakeout.
Uptrend Structure: Price has been consistently respecting higher lows and trending above the green trendline.
Break of Descending Resi
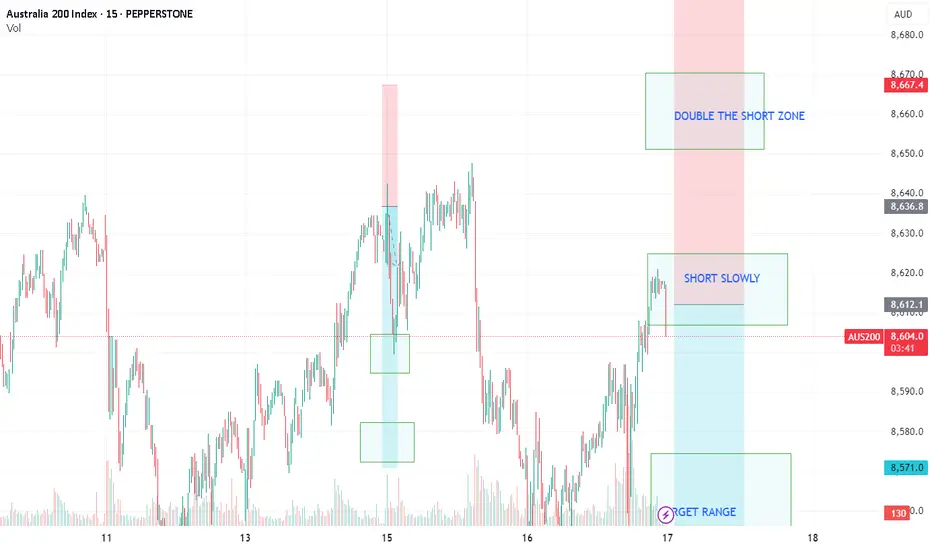
AUS200/ASX200 - ANOTHER DAY TO MAKE THEM PAYTeam, we have successfully SHORT AUS200 last week and kill them with our ACTIVE TRADER COMMUNITY.
Time to have another short at this current price level 8609-8626 ranges
DO NOT FEAR - DOUBLE THE SHORT AT 8642-56 - KILL them
Our first target range at 8586-72 - take 60% profit and bring stop loss to
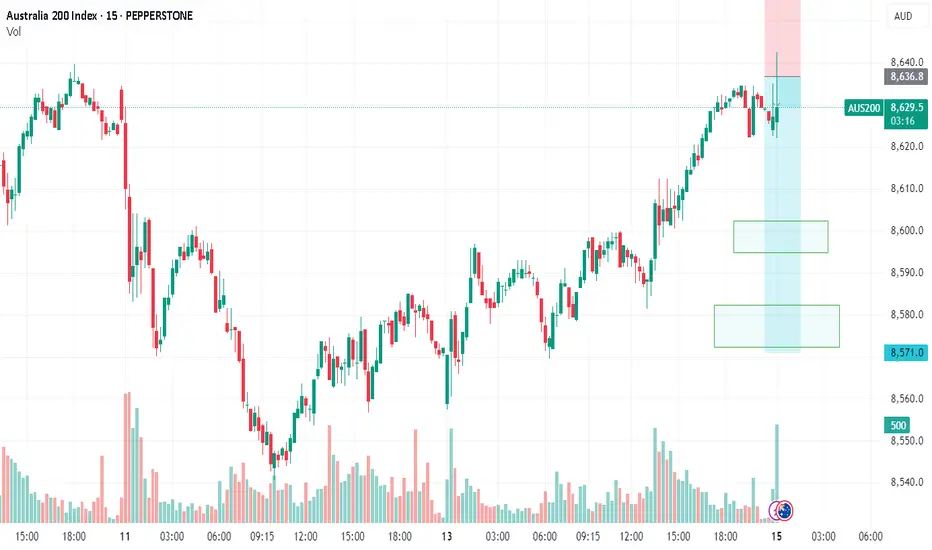
AUS200/ASX200 - OPPORTUNITY KNOCKING OUR DOORTeam, time to SHORT the hell out of AUS200 at 8632 to 8645 ranges
Taking 50-60% target at 8606-8592
ensure bring stop loss to BE once it hit our first target
then second target at 8585-8572
LET'S GO AND KILL THEM.
ASX200- Swing Trade Plan - SELLThe ASX200 has reached last year's high, and bulls have attempted to push the price higher, and we have seen a failure for demand on the weekly for the last two weekly candles.
Seasonality - Risk off.
Price is reached MM3 pivot.
If support is breached on the hourly -8592 and the hourly candle closes

AUS200/ASX200 - LETS MAKE MILLIONYesterday, we hope you all enjoyed SHORT UK100 AND AUS200, we did it twice in our channel
Today we are reshorting AUS200 at 8600-8226 ranges
Target at 8572-8561
Yesterday, while doing REAL LIVE TRADING every day, we killed the NAS AND DOW on a long trade.
Bring us 6 out of 6 trades successful fo

See all ideas
Summarizing what the indicators are suggesting.
Oscillators
Neutral
SellBuy
Strong sellStrong buy
Strong sellSellNeutralBuyStrong buy
Oscillators
Neutral
SellBuy
Strong sellStrong buy
Strong sellSellNeutralBuyStrong buy
Summary
Neutral
SellBuy
Strong sellStrong buy
Strong sellSellNeutralBuyStrong buy
Summary
Neutral
SellBuy
Strong sellStrong buy
Strong sellSellNeutralBuyStrong buy
Summary
Neutral
SellBuy
Strong sellStrong buy
Strong sellSellNeutralBuyStrong buy
Moving Averages
Neutral
SellBuy
Strong sellStrong buy
Strong sellSellNeutralBuyStrong buy
Moving Averages
Neutral
SellBuy
Strong sellStrong buy
Strong sellSellNeutralBuyStrong buy
Displays a symbol's price movements over previous years to identify recurring trends.
Frequently Asked Questions
The current value of S&P/ASX 200 Index is 8,662.0 AUD — it has fallen by −0.92% in the past 24 hours. Track the index more closely on the S&P/ASX 200 Index chart.
S&P/ASX 200 Index reached its highest quote on Jul 18, 2025 — 8,776.4 AUD. See more data on the S&P/ASX 200 Index chart.
The lowest ever quote of S&P/ASX 200 Index is 443.1 AUD. It was reached on Jul 8, 1982. See more data on the S&P/ASX 200 Index chart.
S&P/ASX 200 Index value has decreased by −0.54% in the past week, since last month it has shown a 1.42% increase, and over the year it's increased by 7.04%. Keep track of all changes on the S&P/ASX 200 Index chart.
The champion of S&P/ASX 200 Index is ASX:CAT — it's gained 236.55% over the year.
The weakest component of S&P/ASX 200 Index is ASX:REH — it's lost −52.36% over the year.
S&P/ASX 200 Index is just a number that lets you track performance of the instruments comprising the index, so you can't invest in it directly. But you can buy S&P/ASX 200 Index futures or funds or invest in its components.
The S&P/ASX 200 Index is comprised of 200 instruments including ASX:CBA, ASX:BHP, ASX:RIO and others. See the full list of S&P/ASX 200 Index components to find more opportunities.