AUS200 Forecast/Short OpportunityHey Traders,
Alike many global stock indexes, we are at strong resistance.
This encourages shorts inline with new found downtrend.
The AUS200 is no different.
XJO trade ideas

ASXAUD - BEARISH - 15MFIRST TRADE
Entry: 7041.6
Stop Loss: 7021.4
Take Profit: 7061.8
TP2: 7082
TP3: 7102.2
EMOTIONAL TRADE
Entry: 7075.5
Stop Loss: 7067.5
Tp1:7083.4
Tp2: 7102.3

Lower High In?As price consolidates ahead of Employment Data this week, we can see that over the last few sessions, price has been hovering around the 7.000 area; an important level in the AUX Market. If the bearish forces remain dominant and price fails to break the previous Lower High; we could see a good set up for shorts over the next few trading days. However, if price remains is consolidation or breaks above the previous LH; this could indicate a shift in momentum to the upside; in that case, a fresh analysis would be required.
Patience is a Position

ASX AU200 ~ November TA Outlook (2H Intraday)CAPITALCOM:AU200 chart mapping/analysis.
ASX following US market lead rallying into ~7000 psychological level (50% Fib) & descending trend-line (light blue dotted) confluence zone.

AU200
According to the failure of the desired level and the supply levels and the possibility of conflict
Increasing the price and reaching the desired target is high

AUD200 LongI feel that index all over the world has already factor in geopolitical tension and energy crisis etc....
I feel AUD200 will give good 200-300 point move from here. it also undercut last support level and I feel that it might snap back above the range. I am taking this trade for longer run.
I will close or cut the total exposure if price breaks last swing low.

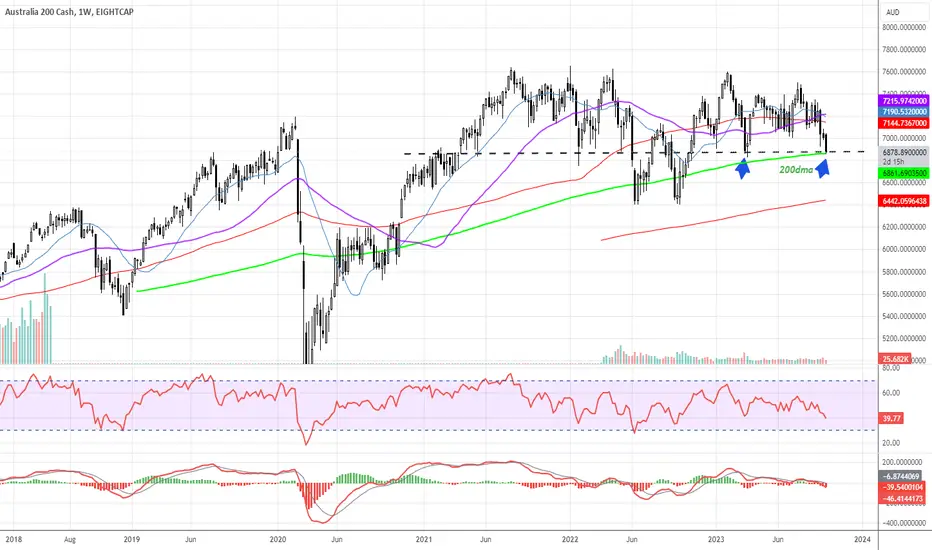
#ASX200 Aussie Index ready for a bounce off the 200dma?Solid level of horizontal support and 200dma on the ASX200 - bounceable area - lets see if we get a reversal here
ASX200: Thoughts and AnalysisToday's focus: ASX200
Pattern – Support/ Regular Divergence
Support – 6885
Resistance – 7000 - 7070
Thanks for checking out today’s update. Today, we have run over ASX200, breaking down the overall price picture, levels, and patterns and incorporating moving average and RSI into the analysis.
Interest today starts from the support hold we are watching from 6885. This lines up with the bottom of the overall range. We can also see regular divergence forming with price holding at this support point. This could set off a new rally that could get back up to test 7000.
If this level of support breaks and price closes below, this could break the range and set off a new overall downtrend. Are stocks a bit oversold at this point? Keep in mind we have US employment data due out this Friday.
Have a great day and good trading.

ASX Index (XJO) vs. Aussie VIX (XVI) ~ Inverse CorrelationAussie Volatility Index wreaking havoc on ASX.
XJO ~6500 range & XVI ~20 range marked out as area(s) of interest for potential supply/demand dynamics, TBC.

Week 1OCT2023 AUS200 Sell Setup # Trading Checklist AUS200
- **Rule** Is there any setup?
- NO Setup NO Trade
- SBR
- RBS
- QML
- QMTR
- BLINDSPOT
- Use a trend-following setup.
- YES
- I love Risky way
- Analyze from a big time frame. Define the Entry Zone
- 30M 4H
- 15M, 1H
- Is there any News (interest rate Decision)
- Yes
- No
- Set both buy and sell zones on a higher timeframe such as 4H or Day for TP and Entry Area.
- YES
- No
- Is it in Premium Zone?
- FIBO 61.8
- FIBO 78.6
- FIBO 50
- Check Is in sideway?
- YES Break Sideway
- NO
- Check Zone within Zone?
- YES
- NO
- Is there Fake out zone
- YES
- No
- The Risk-Reward (RR) ratio should be around 4 or more than 2. If there is an 80% chance of reaching the target, take it.
- 1:3
- 1 :4-5
- More
- Confirmation using Choch.
- Risk Entry
- Confirmation Entry


AU200 - SELL I anticipate a potential downward movement for AU200 on Monday, driven by the presence of an order block at the H1 (1-hour) timeframe, which signifies a likely supply zone. Traders are advised to carefully assess and manage their risk while aiming for profit in this scenario.

Price action analysis on the Major Indexes...its not pretty!!I will go through the daily charts for major Indexes as they come under pressure.
Review the price action and major levels of the DOW, Nasdaq, DAX, FTSE and ASX200.
** If you like the content then take a look at the profile to get more daily ideas and learning material **
** Comments and likes are greatly appreciated **

AUS200 ShortSKILLING:AUS200
Index: AUS200 (ASX 200)
Entry Price (Short): 7051
Stop Loss: 7122
Take Profit: 6698
Risk-Reward Ratio: 5:1 (5 for profit and 1 for stop loss)
Description of the short position:
Short Entry: You open a short position on the AUS200 index (ASX 200) at a price of 7051, which means you are betting that the value of the index will decrease. In other words, you are selling the index with the expectation that its price will go down.
Stop Loss: You place a stop loss at 7122, which means if the price rises to that level, the position will automatically close to limit your losses. This level is above your entry price and acts as a protective measure.
Take Profit: You set a take profit at 6698, which means if the price falls to that level, the position will automatically close to secure your profits. This level is below your entry price and represents the point at which you want to realize gains.
Risk-Reward Ratio: The risk-reward ratio is 5:1, which means you are willing to risk 1 unit of loss (if the price reaches the stop loss at 7122) to gain 5 units of profit (if the price reaches the take profit at 6698).
Please keep in mind that trading in indices and financial markets carries risks, and it's important to have a solid risk management plan and closely monitor the market to adjust your positions if necessary. Additionally, the information provided is based on data up to my last update in September 2021, so you should consider the current market situation and any potential changes in the AUS200 index before making a trading decision.

27 September 2023 - AUS200 SellI am selling AUS200 as I see it breaking out of a daily/weekly range to go down

XJO potentially trying to tell us something?I'll try to write a big description later on but from looks could be Stage D ?

ASX 200 ~ 2H Intraday Chart (Sept-Oct)CAPITALCOM:AU200 chart mapping/analysis for short-term & intraday trades.

ASX 200 ~ Daily Swing Chart (Sept-Oct)CAPITALCOM:AU200 chart mapping/analysis for med-long term swing trades.

AUS200 HARMONICS LONGI have a long after, that i discovered this beautiful kind of Harmonics, what swept the liq.grab. Main goal is to reach POC

ASX 200 Index: Bullish Momentum Gains Ground After 4-DayIntroduction:
After a four-day downward trend, the ASX 200 Index is showing signs of a bullish resurgence. In this article, we will analyze the recent price action, key technical indicators, and the potential factors driving the market as it attempts to break out of a crucial resistance level.
Breaking the Red Streak:
Following four consecutive days of declines, the ASX 200 Index has finally made an impressive upward move, finding strong support at the previous week's low price. This reversal has ignited hope among traders and investors, as it marks a crucial shift in sentiment. The next challenge on the horizon is the previous week's midpoint, currently positioned at 7239. Interestingly, this level coincides with several key moving averages, including the MA 50, MA 100, and MA 200. By this point, the MA 20 should ideally have already been surpassed, signifying further bullish momentum.
Overcoming Resistance:
Despite the recent gains, the market still faces a formidable obstacle in the form of an overhead trendline acting as resistance. However, the current setup suggests that this could be the moment when this resistance is successfully breached. The week ahead is expected to bring a deluge of economic news, which could act as a catalyst, increasing market volatility. This potential uptick in volatility is reflected in the Average True Range (ATR) indicator, which has started to point upward, indicating a potential new higher high.
RSI and Momentum:
The Relative Strength Index (RSI) is another critical indicator that has caught our attention. It exhibits a clear change in direction, now pointing upward. Importantly, the RSI is still some distance away from its overhead trendline resistance, leaving room for further bullish momentum to develop.
Zooming Out:
Taking a broader perspective by examining the weekly chart of the XJO, it appears that we may be in the midst of a Wyckoff accumulation phase, preparing for a breakout in Phase D. Confirmation of this pattern would come with the breakout of its macro channel. However, it's crucial to approach this potential breakout cautiously, taking things day by day and week by week, considering the evolving market dynamics.
Conclusion:
In conclusion, the ASX 200 Index has shown promising signs of recovery after a four-day decline. The recent breakout above the previous week's low, coupled with the convergence of key moving averages, suggests that the bullish momentum may continue. Traders should keep a close eye on the overhead trendline resistance and the impact of upcoming economic news on market volatility. The RSI and ATR indicators also provide valuable insights into the potential direction of the market. As we monitor these developments, it's important to remain cautious and vigilant in navigating the ever-changing landscape of the ASX 200 Index.

ASX 200 ~ 2hr Intraday Chart V2Chart mapping/technical analysis of CAPITALCOM:AU200 for developing short-term Intraday Trade strategies.
CAPITALCOM:AU200 ASX:XJO ASX:XVI

ASX 200 ~ Daily Swing Chart V2Chart mapping/technical analysis of CAPITALCOM:AU200 for developing med-long term Swing Trade strategies.
CAPITALCOM:AU200 ASX:XJO ASX:XVI

AUS200 - Bullish Divergence - Possible Trend Reversal?PEPPERSTONE:AUS200 was in a bearish trend, however, bullish divergence was formed and price looks to be gaining bullish momentum! Hoping for series of higher highs and higher lows to form following the bullish divergence!
