AUSTRALIA200's next BIG SHORT is on the wayThis indicies has a high potential to make a down move/Wave/ on more time,from the technical side. On the fundamental side Covid-19 pandemic 2nd wave is about to start around the world.
Anyway I'd like to suggest you a short position on this instrument, of course you need a risk to reward ratio and risk percentage. Good Luck
XJO trade ideas

Stock of the week: ASX:XJO aka ASX200Today`s stock of the week episode will explore index ASX:XJO. I chose not to analyse one single stock cause my last post about XJO, I had informed you that I will keep you posted if anything price-action wise changes. Things have quickly escalated that is why I am going to analyse this index for you. Lets analyze.
The ASX200 has been on the uptrend since the early March 2020. The bulls have been on fire chasing bears all the way from the abyss to the 0.618fib(6128$). But the bears were back in the game since the 0.618fib did not break and they want to play it hard and kick the bulls` butts. Below is the technical analysis and what we can deduce from it.
- Recent retries by the bulls got stopped out by the 5969 resistance line. you can see 3 indecision candles that started a warning sign showing that bulls dint have enough juice.
- The LSMA looks downward which is not a good sign for bulls
- The daily velocity turned negative
- The bulls are still in good shape cause the uptrend line is not broken yet.
Below is what I think would happen if the critical point( confluence uptrend line and 0.5fib) on the chart is broken:
- my first target will be the 50 SMA (around 5600$) where a bounce back can be anticipated
- if first target broken second target is range 5460 to 5500 where ascending triangle broke to the upside and where the 0.382 fib is located.
At the moment, I am not bearish yet but if the uptrend line breaks and bulls dont reclaim it quickly. I may start closing most of my long positions held since late March and wait for clear opportunities before entering the market again.
I will keep you updated if anything changes all along next week.
keep smashing the likes and have profitable trades next week.
XTF

$AUS200 let the game begin As we recall the first breakout lower from stock market tops just started from Australia. AUS200 now alongside DJIA is the first one to nearly break rising wedge resistance and lead orchestrated reversal lower.

XJO As expected we have come back to close on the neckline of the W formation, this has come inline with the 0.618 FIB. Expecting a reversal tomorrow, creating a higher low. DYOR, IMO. Expecting reversal to previous support, likely short term resistance. We may see a break through our previous channel we were bouncing in. Lets hope for some impulse legs to break through.


Trade Idea on AU200 (ASX) by ThinkingAntsOkMain items we can see on the chart
a) The price is on an ascending Wedge
b) Currently, we can observe a clear corrective Structure (Yellow lines)
c) The next resistance zone we have is a weekly one (light blue rectangle)
d) Based on the technical elements we have our conclusion is: If the price breaks above the corrective Structure, that will give us a high-quality scenario for long trades towards the next resistance zone
e) The Risk-Reward Ratio of this trade is 1 : 2
f) We will move our stop to break even at 6200.00
WEEKLY CHART: (Understanding why we choose that target)


Aussies heading into troubled zoneThere are no promises, guarantees or predictions in this.
The Aussies have been flattening out at a top - it appears - at this time. There are only two directions for price - nothing new in that.
What happens in situations like these is:
1 - either price collapses.
2 - it rockets north.
You can imagine what bulls and bears would say to each of the above. Their inherent biases controls their minds. Biases predetermine - quite unconsciously - what logic will arrive at. Hence people get into 'predictions', then punch the air when price confirms their bias.
Both the nature of confirmation bias and prevalence-induced concept change should be studied by all traders. Some say ' What's psychology got to do with this? ' I'm sorry for some.
How does one control how wrong a bias may be? It's called a stoploss!
Disclaimers : This is not advice or encouragement to trade securities. No predictions and no guarantees supplied or implied. Heavy losses can be expected. Any previous advantageous performance shown in other scenarios, is not indicative of future performance. If you make decisions based on opinion expressed here or on my profile and you lose your money, kindly sue yourself.


@Level 2We are at level 2, whether price advances to level 3 will wait and see given the W formation at level 1, overall I expect price to drop in the coming weeks

AUS200 Symmetric triangleAUS200 index looking at triangle build-up and could be signs of huge pressure building on the bullish side

AU.XJO Continuation Wedge - Bullish possible outcomeAU.XJO Continuation Wedge - Bullish possible outcome


Asx 200 Short positionI believe ASX 200 could be go down upto 4K in coming weeks.
I have short the position at @5960 and will book my profit @ 5100 - 5300
Share your ideas
Thanks


ASX:XJO still in the uptrend This chart should be self explanatory but as a chartist i cant do without a comment.
XJO is still in the uptrend on the weekly chart. Last week and early this week it has come to retest the uptrend line which acted as support in conjunction with the 0.5fib and pushed the price up again.
Weekly psar is still showing uptrend and lsma still in uptrend on a weekly TF.
One concern so far is the 200WMA aligned with the historic resistance around 5969$. And daily psar is not positive yet.
I will keep you posted if anything changes as I always keep an eye on these markets.
Keep smashing the likes and stay tuned to my “Stock of the week” new episode this Sunday.
Stay safe and nice weekend.

XJO aka ASX still in the uptrendThis chart should be self explanatory but as a chartist i cant do without a comment.
XJO is still in the uptrend on the weekly chart. Last week and early this week it has come to retest the uptrend line which acted as support in conjunction with the 0.5fib and pushed the price up again.
Weekly psar is still showing uptrend and lsma still in uptrend on a weekly TF.
One concern so far is the 200WMA aligned with the historic resistance around 5969$. And daily psar is not positive yet.
I will keep you posted if anything changes as I always keep an eye on these markets.
Keep smashing the likes and stay tuned to my “Stock of the week” new episode this Sunday.
Stay safe and nice weekend.

Ignore this, pretty lines6750 +- 50 Aug 1st calls
Noticed eerily strong hits with a 40 year fib from jan 1980.
Fib comparison between 1980-2020 and Feb 2020 crash.
Macro vertical trends, cant be bothered doing horizontal analysis right now (they're a pain), so can't get a definite date.
6771 by early august.

ASX200 breakout build-upASX200 pricing within a range.
This is generally a really good indication of a potential strong build-up for a breakout.
Watch out for any fake moves and find opportunities to follow the trend.


19/06/2020Today market moved as expected, we have recently changed environment by making lower lows compared to recent moves. A W formation was created on the 4 hourly between the 12th and the 16th. I really want to see the market close on either the 0.382 FIB or preferably the 0.5 FIB which would provide strong confluence and support at this level. I will watch closely around the 0.382 to see if there is a shift in market sentiment and the rally will continue to make higher lows and higher highs. The wick from the first half of today I expect to get filled in the next day or two. 3855 would be ideal for me to feel safe to hold long term from here. DYOR, all IMO.
6497 - A possibility if the 0.382 FIB is the only once reached.

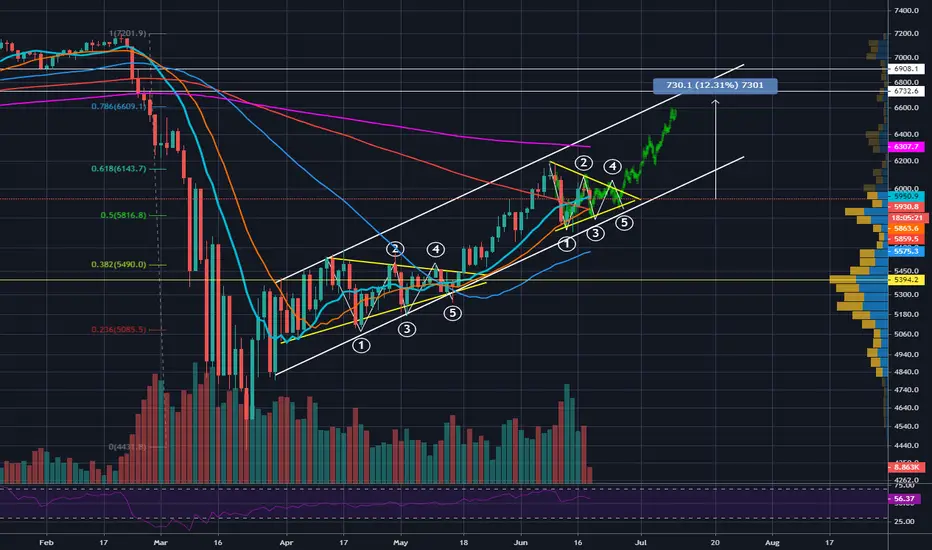
AU200AUD 2nd Elliot Wave Symmetrical Triangle PatternMy first target has been hit and its looking like another symmetrical triangle pattern may be forming. Price remains bullish over the 20dma and 50dma. This is a good place for consolidation under the 200dma to store enough energy to break through. There is a gap that isn't shown on this chart in the general target zone to be filled as well.
Next entry for stocksImpulse, correction, hope to see it come back to the 0.5 FIB. Also close the neckline of the W formation. IMO, DYOR.
