This Coin Is A POWERHOUSE MartyBoots here , I have been trading for 17 years and sharing my thoughts on AAVE here.
AAVE is looking beautiful , very strong chart for more upside
Very similar to XRO which mooned from this structure
Do not miss out on AAVE as this is a great opportunity
Watch video for more details
XRO trade ideas

Buying idea XRO with stop at 168.80XRO has done well and at all time high. after breaking out with earnings now made some consolidation before the next move. we can see if this momentum continue with a decent stop at 168.80.
DISCLAIMER : The content and materials featured are for your information and education only and are not attended to address your particular personal requirements. The information does not constitute financial advice or recommendation and should not be considered as such.

Key Observations on Xero's Journey🔰 ASX:XRO Key Observations on Xero's Journey
1. The Big Rally: June 2018 to February 2021
Growth: Xero experienced a significant rally, climbing 243% from around $46 to $158.
Timeframe: The rally spanned 126 weeks (882 days).
Volume: Total trading volume during this period was 361.303 million.
Key Insight: This rally followed a long consolidation phase, a typical setup for strong upward momentum in stocks.
2. Support and Resistance Levels
Support Zones:
The $100–$110 range acted as a strong support level, with the stock bouncing multiple times before moving higher.
Resistance Zones:
The $171 level became a key area of resistance during its historical highs.
Key Insight: Understanding historical support and resistance levels can help identify areas where stocks may reverse or consolidate.
🔰 Lessons from Xero's Stock Performance
Patterns Repeat, But Not Predictably
Historical performance offers valuable insights but does not guarantee future results. Always focus on the bigger picture.
Volume Confirms Strength
Rising volume during rallies can be a strong signal of market confidence, while declining volume might indicate weakening momentum.
Support and Resistance Matter
Understanding key price levels can help identify potential turning points in stock movement.
Earnings Drive Volatility
Always pay attention to earnings seasons as they historically trigger significant price movements.
🔰 Conclusion: What Can We Learn?
Xero’s historical data tells a story of growth, retracement, and strong investor interest during key phases. By analysing these patterns, investors can better understand how price, volume, and market cycles interact. However, it’s crucial to remember that past performance is not a predictor of future results.
✅ Join the Discussion
What trends or insights do you observe from Xero’s historical performance? Share your thoughts in the comments below
Disc: no holding , no recommendation to buy or sell - may buy or sell without any notification , treat this post as learning only. consult with your financial advisor before taking any financial decision

Bitcoin About To Go ParabolicMartyBoots here , I have been trading for 17 years and sharing my thoughts on the crypto market.
This videos shows how Bitcoin can go parabolic and we need to watch very carefully over the next week or 2 .
For more information or any questions just send me a message
MartyBoots


XRO 1H BOXRO in a strong weekly trend and consolidating near highs for a BO of local 145 resistance, alert on BO and watch for pullback to next level

XRO Cup and Handle Possible $30+ moveHave a look at the chart, this large cup and handle shows a move back to all time highs. Could also go south but Indicators are currently poiting up.

XROXero is a New Zealand–based technology company that provides cloud-based accounting software for small businesses. The company has offices in New Zealand, Australia, the United Kingdom and the United States.
Looking to break to the upside of it's consolidation range.


XERO 3WK AnalysisXERO touch bottom trendline at around 64. Expect price to break the RED trendline.
Price may touch strong resistance at 90.

Macro LongYes could be more downside but this correction is looking like it's near completed which will complete a larger wave 1-2 - setting the stage for a future macro wave 3 to make new highs.
ETH Is About To Absolutely MOON Into A Bull Market MartyBoots here. I have been trading for 14 - 15 years and I am here to share my ideas with you to help the Crypto space.
Bitcoin & ALT Coins are Setting up for a HUGE bounce and we in CryptoCheck intend to make lifechanging money
DO NOT BE LEFT BEHIND
------------------------------------------------------------------------------------------------------------------------------------------------------------
If you want help trading Bitcoin or any other ALT coins hit me up , We will improve your trading . Have a look at the link below
------------------------------------------------------------------------------------------------------------------------------------------------------------

Time to add Xero to the watchlist $XROThis stock has been trading sideways since the start of the year,
If we can break out of this chart pattern and to the upside, it's a buy for me.

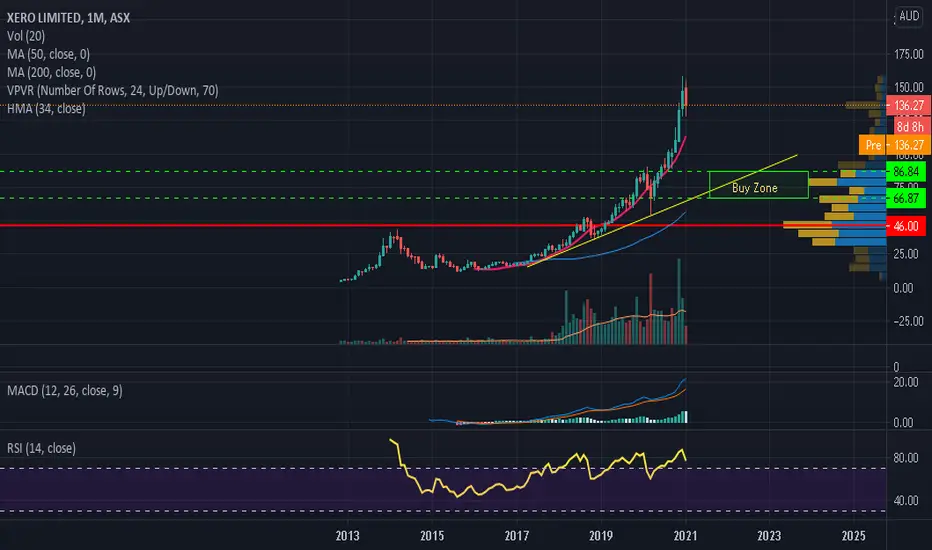
XRO - Road MapXRO has showed a spectacular run in 2020 but since Jan 2021, it seems that XRO needs a breather and the double top kind of price action shows that it might have turned or about to turn for a decent pull back. I will be a confident buyer at or near my buy zone between $78.00 and $80.00, which is also its trendline support. I will be closely watching price action if and when we get there.

ASX based XERO on a European Acquisition TrailXero has been recovering nicely and managed to move up through a couple of fairly solid resistance points.
It is starting to approach old time highs again, so might be a bit of a short term pullback in the next couple of days, but it is looking good in the medium to long term, and there really doesn't seem to be much in the way of competition these days - certainly not in the Australian landscape.
With their recent purchases of Swedens Tickstar (e-invoicing specialist) and Workforce Management Platform Planday it looks like they will be expanding their service offerings and hopefully in turn attracting more revenue and any businesses who have resisted switching across while awaiting those functionality changes.
Any stock market recovery will likely be led by tech stocks, so Xero is certainly worth keeping an eye on.

XRO - Will the rally continue?XRO has been in its parabolic rise but will it continue further up. XRO has catapulted straight up in a straight line since a few years and any asset exhibiting such a parabolic move may often be followed by a sharp decline in price value. XRO has so far got rejected in the month of January 2021, at around $155.00 and currently trading at $136.00. Could it be the start of a decline in its price value?
The Monthly RSI value is 77.58 and the Weekly RSI is now at 64 after being extremely overbought and cooling off after giving a reading of 83 two weeks earlier. We can see a Bearish Engulfing Candlestick pattern forming this month though the month has not finished yet, but we should be mindful of the fact that if it closes this month weak, may be at the current levels or weaker, then it might continue lower in the months ahead for a deeper pull back.
It seems that at these current levels, it is extremely risky to buy XRO. We could see the pullback towards the 50% to 61.8% zone between $65.00 - $85.00 for a potential buying opportunity.
Please note these are my own notes for future reference, by no means trading advise for anyone. Please do your own research before entering into any trade.
XERO completing double ABCD harmonic with huge red volume spikeXERO completing double ABCD harmonic with huge red volume spike. Everything is wrong about this stock even fundamentally guidance is poor and PE is ridiculous 1000 plus . piling on debt for whatever reason not known . zero interest rate speculative mark up coming to and end and distribution phase started this past week . JP morgan labeled a target of $88

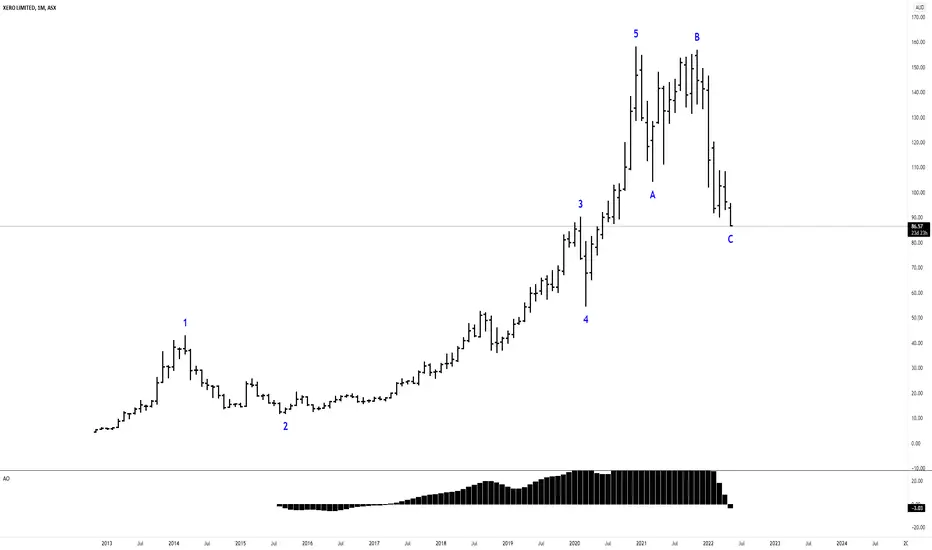
XERO - Love the Fundamentals - but ?One to keep an eye on. Looks to be a very obvious/classic elliott wave formation in the XERO chart. The wave 5 formation has started to go a little parabolic of late which suggests an A-B-C correction is now a fairly high probability. As much as I like XERO'S fundamentals, might be best to be patient here.


$XRO:ASX - XERO LIMITED - Through resistanceXERO through resistance and continuing to run nicely. Worth a watch.

$XRO:ASX - XERO LIMITED - Up 115% for the yearXERO has been a great little runner over the last 12 months on the ASX and starting to look like challenging the $90 mark and then onto $100 with any luck. RSI still indicates plenty of value left and it is such an embedded finance / accounting system across most small businesses in Australia that it could well be worth a look.
Xero Ltd. engages in providing online business solutions for small businesses and their advisors. The company founded by Rodney Kenneth Drury and Hamish Edwards on July 6, 2006 and is headquartered in Wellington, New Zealand.

XRO technical analysis PT $100ASX:XRO I have been watching XRO quite long time. Solid bullish pattern, and price target is $100.
Good luck mates, don't miss the train.

