Navigating the Temporary Rebound in Wheat PricesWheat prices have recently strengthened, supported by a surge in exports. However, the upcoming main harvest season is expected to boost supply significantly, which may lead to oversupply and downward pressure on prices. This dynamic presents a compelling opportunity for astute portfolio managers to

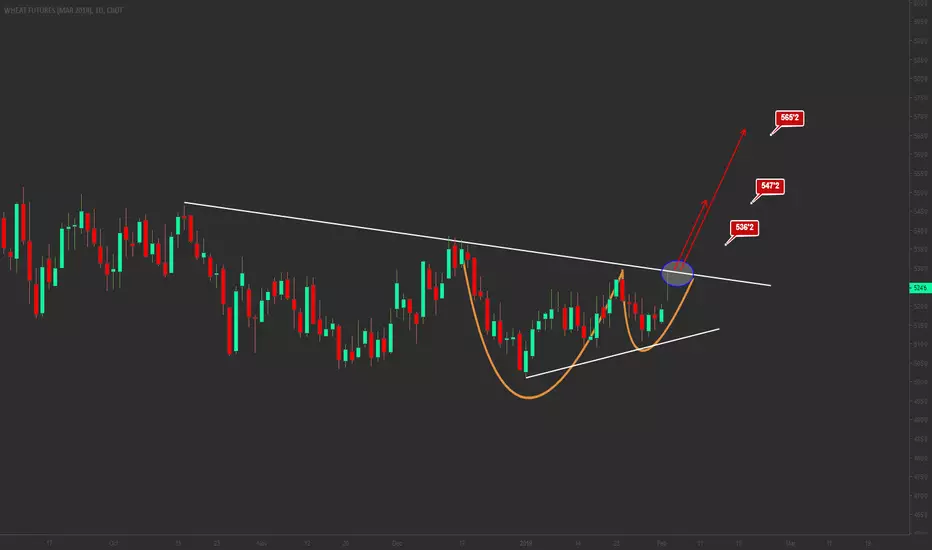
Wheat Futures - Bump to 593 and Possible BreakoutWheat has a solid base at ~540. Every time we have pushed to or above the red down sloping trendline we reverse to this level. This has formed a triangle that is reaching a decision point that may yield to a breakout of this low level and a push above the 600 level. Given that the price has held fir

WHEATN2024 ShortWheat price did higher highs, RSI did lower highs, we have a bearish divergence.
Wheat daily RSI is overbought.
Fibonacci extension shows that it can $641, that corresponds to 1.618 Fibonacci.
Also we have the white lines that correspond to current supports, at $650 and $633.
Thank you.

Wheat and Fertilizer Futures: A Cash Cow for War Mongers In this layout I have Black Sea Wheat and Corn, Australian and Ukrainian Wheat, and 4 main Fertilizer (UREA) Futures.
Conflict and Wars are good ways for Financial Institutions like Black Rock and State Street Corp oration to make a lot of money. What better way than to destroy the wheat fields

Black Sea Wheat futures SHORT to $250Futures for Black Sea Wheat are clearly on the downside due to fundamental reasons. Finally, Ukrainian Wheat is transported by ships and also from the Baltic Sea through Poland, Lithuania and Latvia. It is relief for many reasons like global hunger, stabilization of basic food prices etc. Emotion ar

Ukraine is the 2nd largest....supplier of grains to the European Union. Most wheat crops are planted in fall and harvested in July (spring wheat is planted through March and should be largely in in the soil already).
Even though prices are shooting up, the total planted area is still about in line with with long-term trends

WHEAT Futures Long OpportunityProspects for lower than expected acreage in 2019 could help firm the market, but demand still looks modest. Flooding can be an issue in some countries.
The short term trend is turning from bearish to neutral.
Wait for the breakout of 530.
Midnight moves KCWheat futures forced liquidity??Picture perfect stop hunt. Back on the rise? Huge potential here.
600% is the goal :D

1W Channel Up. Long opportunity.1D Channel Up with support at 528.40 within a 1W Channel Up with support (Higher Low) at 510.00. Any of those can be used as stops on longs with targets = 574.20 & 588.20.

WN2017 - July '17 Wheat FuturesAs the market made lower lows, the MACD indicator made higher highs. This is very powerful bullish divergence. Circled is where the MACD crossed over to the upside, further indicating bullishness.
Stops should be placed slightly below the most recent low of 429'4, which occurred on March 31.
Pro

See all ideas
Summarizing what the indicators are suggesting.
Neutral
SellBuy
Strong sellStrong buy
Strong sellSellNeutralBuyStrong buy
Neutral
SellBuy
Strong sellStrong buy
Strong sellSellNeutralBuyStrong buy
Neutral
SellBuy
Strong sellStrong buy
Strong sellSellNeutralBuyStrong buy
A representation of what an asset is worth today and what the market thinks it will be worth in the future.
Displays a symbol's price movements over previous years to identify recurring trends.
Related commodities
Frequently Asked Questions
The current price of Eastern Australia Wheat Futures (Jan 2027) is 345.0 AUD / TNE — it has risen 0.29% in the past 24 hours. Watch Eastern Australia Wheat Futures (Jan 2027) price in more detail on the chart.
Track more important stats on the Eastern Australia Wheat Futures (Jan 2027) chart.
The nearest expiration date for Eastern Australia Wheat Futures (Jan 2027) is Jan 22, 2027.
Traders prefer to sell futures contracts when they've already made money on the investment, but still have plenty of time left before the expiration date. Thus, many consider it a good option to sell Eastern Australia Wheat Futures (Jan 2027) before Jan 22, 2027.
Buying or selling futures contracts depends on many factors: season, underlying commodity, your own trading strategy. So mostly it's up to you, but if you look for some certain calculations to take into account, you can study technical analysis for Eastern Australia Wheat Futures (Jan 2027). Today its technical rating is sell, but remember that market conditions change all the time, so it's always crucial to do your own research. See more of Eastern Australia Wheat Futures (Jan 2027) technicals for a more comprehensive analysis.