Trade Setup for ATOM Thursday!
- 📍 Entry:$11.59
- 🛑 Stop Loss:$10.72
- **🎯 Target 1 (T1): $12.75
- **🎯 Target 2 (T2): $14.35
- **📉 Pattern: Falling wedge (bullish breakout expected)
- **⚠️ Note: Watch volume for breakout confirmation! 🚀
ATOM trade ideas

Atomera WXYXZ Elliot Wave CorrectionAtomera, which has been in a downtrend since February 2021, may go to a price range of 2.86-3.69 with the Elliot WXYXZ correction if there are no significant progress in 2024.
My guess is that we can see these prices in the first half of 2024.

ATOMERA Weekly Technical AnalysisATOM Weekly - No RECOMMENDATION or ADVICE Status / EDUCATIONAL only - Support, Resistance, Trend Lines , Parallel Channels, Confluences, Clusters, Fibonacci Extension - Hope it Helps, Good Luck
DISCLAIMER - This communication is not trading or investment advice, recommendation or solicitation to buy, sell or hold any investment product is provided for informational, educational and research purposes only. All illustrations, forecasts or hypothetical data are for illustrative purposes only. The author or persons involved in the conception, production and distribution of this material cannot be held responsible for transactions or any financial loss or damages resulting directly or indirectly from the use or application of any concepts or information contained in or derived from this material. Past performance is not indicative of future results. Any person who chooses to use this information as a basis for their trading assumes all the liability and risk for themselves.


ATOM up part 2an old stock I liked way back when, and it looks to be getting ready for a move up to 10 dollars again. Earnings are tomorrow, so please be careful. Technically we are at long term horizontal support with a falling wedge and weekly bull divergences. It's a nice setup, but of course - this could fail miserably. Again, please be careful.

ATOM :: Falling in the end !ATOM :::
The price has broken out of the larger channel and corrective movements are shown in a smaller channel .
The price will move towards the bottom of the bigger channel, but due to the resistance there, the price will move down .
Resistances :
1_ Floor of the bigger channel .
2_ The roof of the smaller channel .
3_ Linear resistance .

ATOM - Is this overvalued small cap about to 30x?ATOM is a small cap semiconductor stock trading at over 700x sales. Lol. Insanely overvalued! That being said, ATOM's market cap is dirt cheap at 273 million. So this is definitely a "squeezable" stock.
I'm a newbie at EW theory, and still learning, but I'll give it a shot regardless. I think ATOM completed a 1:1 5-3-5 ABC zigzag correction. Most zigzags usually occur on a Wave 2, so it's possible the next 5 waves of wave 3 take ATOM to new all time highs at the bare minimum of $330.80. Additionally, volume since ATH has drastically decreased which is more evidence price action since ATH has been corrective compared to the high volume on the previous impulsive wave.
Daily Bullish Divergence on RSI and MACD at the 1 fib level ($9.2) which coincides with a high volume node on the volume profile suggests that ATOM has set a bottom. Earnings imminent.

ATOM: Wrong TickerI wanted to buy some ATOM crypto, but accidentally stumbled onto the stock ATOM instead. Weekly Bullish Divergence on Momentum, Money Flow, RSI. ATOM is spending a lot of time hovering around the 1 fib level at $9.3, but I believe there will be a final flush to the $8 range. Tons of confluence between the .618, 1.618 fib and a historical support level. Setting buy limit orders for an initial position at $8. Weekly RSI should be oversold when ATOM hits $8.

ATOMERA Weekly Technical AnalysisATOM Weekly - No RECOMMENDATION or ADVICE Status / EDUCATIONAL only - Support, Resistance, Trend Lines , Parallel Channels, Confluences, Fibonacci Extension - Hope it Helps, Good Luck

Atomera May Drop SoonBased on historical movement, the peak could occur anywhere in the larger red box. The final targets are in the green boxes. The pending bottom should occur within the larger green box as has been the historical case. Half of all movement has ended in the smaller green box. In this instance, the signal indicated SELL on February 11, 2022 with a closing price of 15.8.
If this instance is successful, that means the stock should decline to at least 15.58 which is the top of the larger green box. Three-quarters of all successful signals have the stock decline 5.756% from the signal closing price. This percentage is the top of the smaller green box. Half of all successful signals have the stock decline 9.602% which is the end point of the black dotted arrow. One-quarter of all successful signals have the stock decline 15.873% from the signal closing price which is the bottom of the smaller green box. The maximum decline on record would see a move to the bottom of the larger green box. These are the same concepts for the levels in the red boxes as well.
The ends/vertical sides of the boxes are determined in a similar fashion. The trough of the decline can occur as soon as the next trading bar after signal close, while the max decline occurs within the limit of study at 35 trading bars after the signal. A 1% decline must occur over the next 35 trading bars in order to be considered a success. Three-quarters of successful movement occur after at least 2 trading bars; half occur within 4 trading bars, and one-quarter require at least 17 trading bars.
The black dotted arrow represents median historical movement. Medians are a good metric, but they are just one of many I use when forecasting future movement.
As always, the stock could decline the very next bar after the signal without looking back (therefore the red boxes would not come into play) or the stock may never decline (and the green boxes may never come into play).

Atomera deatomizing (look it up). ATOMBearish outlook for gains at 14.53, then 12.44 and 9.46. Invalidation at 24.04.
We are not in the business of getting every prediction right, no one ever does and that is not the aim of the game. The Fibonacci targets are highlighted in purple with invalidation in red. Fibonacci goals, it is prudent to suggest, are nothing more than mere fractally evident and therefore statistically likely levels that the market will go to. Having said that, the market will always do what it wants and always has a mind of its own. Therefore, none of this is financial advice, so do your own research and rely only on your own analysis. Trading is a true one man sport. Good luck out there and stay safe!

Atomera Corporation-$32 programmed (Atom)It’s building enough momentum to the upside...
Gonna take time but it’ll surely come to pass.
For educational purposes only :(

ATOM bullishSry meant to publish a couple days ago but I was busy
Still expecting continuation
gonna watch it and enter if looking all good
Just my opinion not financial advise

$ATOM Cannot get tighter than thisAs the title reads, accumulation has taken place for a long time, basically for an entire year. Breath in the directional indicator shows a small whammy to the upside (DI over 25+ will confirm the move) last Friday when Atomera turned green on the day and was rejected by the ATHs VWAP. This VWAP level will prove important this week on whether price is kept below for more accumulation or start showing demand above. The POC at 23.55 should prove to be decent support and any daily print below 22.04 is a stop loss and a trend reversal in the short term. Trading plans on the chart.

ATOM Solid and looking for the Continuation.Remarkable on the Monthly. In the face of the Weekly Resistance and the S&P Beat Down.
Marching on, just know this is in the battle Zone.
It may do that grind and haul by the penny.
Short termers and risk averse taking profits.
The ride is not over yet.
Namaste Traders.

Break down of ATOM on the hourly.Break down of ATOM on the hourly. Careful out there traders.
Been really strong and a good ride up.


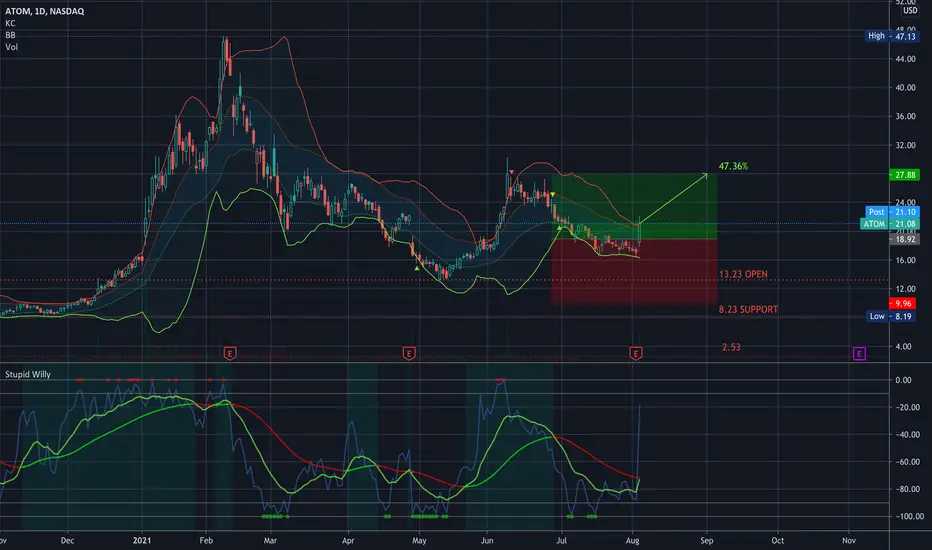
$ATOM Target 27.88 for 47.36% $ATOM Target 27.88 for 47.36%
Well... let's go...
-----
—
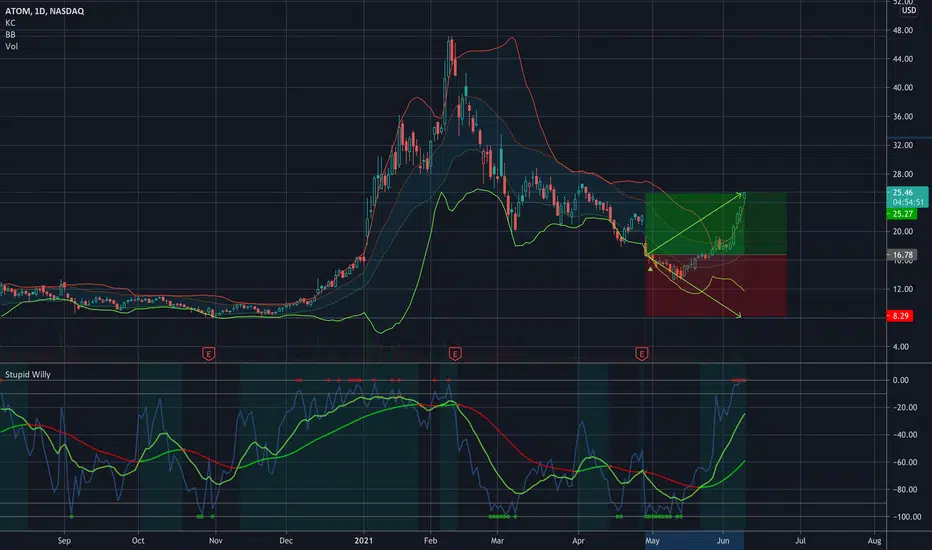
On the far right of the chart is my Average (Grey) Current Target (Green), and Next Level to add (Red) Percentage to target is from my average.
ONLY ADD at support levels & FIB levels… labeled
I start every position with .5 - 1% of my account and build from there as needed and as possible.
I am not your financial advisor. Watch my setups first before you jump in… My trade set ups work very well and they are for my personal reference and if you decide to trade them you do so at your own risk. I will gladly answer questions to the best of my knowledge but ultimately the risk is on you. I will update targets as needed.
GL and happy trading.

🟢 NEW POSITION $ATOM Target 30.25 for 42.09%$ATOM Target 30.25 for 42.09%
Or double position at 12.33
—
On the far right of the chart is my Average (Grey) Current Target (Green), and Next Level to add (Red) Percentage to target is from my average.
I start every position with 1% of my account and build from there as needed and as possible.
I am not your financial advisor. Watch my setups first before you jump in… My trade set ups work very well and they are for my personal reference and if you decide to trade them you do so at your own risk. I will gladly answer questions to the best of my knowledge but ultimately the risk is on you. I will update targets as needed.
GL and happy trading.
I finally added my YouTube Training Video to my profile tagline since I’m not allowed to on here. It’s a quick 15 minute training video on how to set up your chart and how to spot opportunities. So check here first but If you have questions just message me.

WATCHING $ATOM for ENTRY TARGET @ 21.29WATCHING $ATOM for ENTRY TARGET @ 21.29
I'd play this one again at that entry for sure... this one was so fun last time.

OH SNAP!!!! TARGET HIT $ATOM @ 25.27 for 50.6% Profit in 41 daysTARGET HIT $ATOM @ 25.27 for 50.6% Profit in 41 days
DAMN... Almost to the DAY 🙌🏼🥳
Congrats if you played this one with me!!!