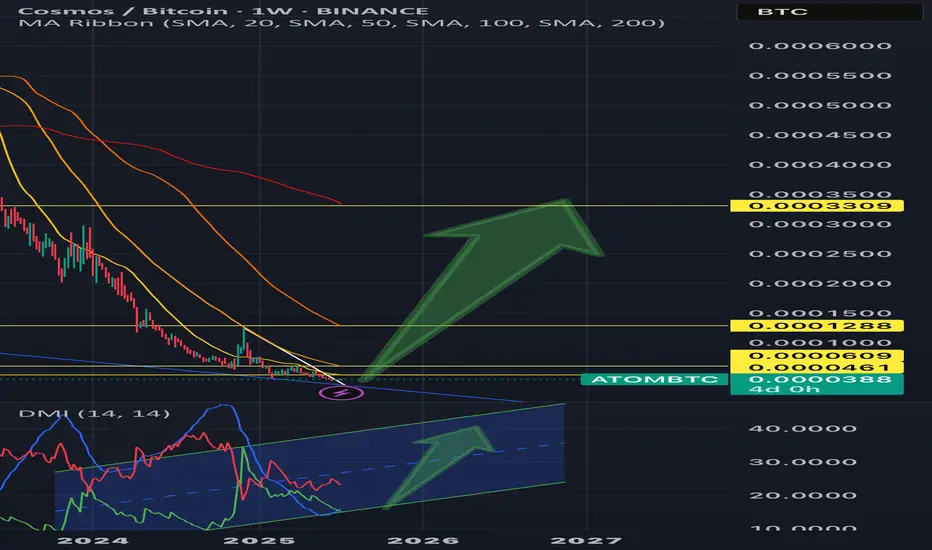
ATOM | COSMOS - REVERSAL SIGNALS & KEY LEVELS💫Here’s a detailed weekly ATOM/BTC analysis—focusing heavily on the Directional Movement Index (DMI) combo—and a forward-looking forecast.
💫 While ATOM/BTC is currently in a strong downtrend, the presence of bullish RSI divergence on a weekly scale suggests that the strength of this trend may be fa
Related coins
$atom-Make Atom Great Again so flip this reclaim of previous key support or range low
come back down to test it and possible take stops
thats your entry not now or yo could enter right now to front run the inevitable
3x or $24 ish is all i want for Christmas

ATOM Forming bottom against BTCBullish divergence plain and simple. Masssssivvveee bleed from ATOM the past long while but now we seeing volume spikes and RSI divergence.
Bitcoin dominance needs to release and if so we might get a good run out of ATOM.
NFA, just an idea.

ATOM , AI suggested opportunityAs you can see Atom can have great growth.
Please do your own research.


Buy now or cry later: ATOMs 5 year wykoff accumulation schematicHi tradingviewers!
This is my first post that I’ve decided to share and it definitely excites me to share this one with you! Before I start apologise for formatting etc as I need to get use to how all this works.
I’d like to start off by saying I am not a full expert in wykoff but have been learni

ATOM/BTC Long HTF TradeI have been looking for a good long opportunity against Bitcoin. With the high volume of capital inflows to crypto that has been stimulated with the ETF/Halving Bull Cycle, the question is, where will it flow to next?
Meme coins, old school cryptos, L2s, gaming?
The answerer is all of the above.

ATOM - Primed and ready to rollBullish divergence, bottom of huge range, BTC making ATH
What else can I say? Could be some further volatility to wash out people but hard to not expect a rally when alt-season hits.
400% potential
SPOT only
take profit on the way up
NFA

ATOM bottomMeasuring the 6M bullish breaker i can say we're at the bottom for ATOM against BTC, this means it should gain traction from here on.
Looking at the chart it is possible to see, price is at the 2nd levl of manipulation.
Target is 0.00146 at the very least the EQH 0.001033 (4x-6x)
NFA

ATOMBTC TA with levels, volume and Fibs.Seems it's getting to the bottom.
I don't think that it will get to last red box.

See all ideas
Summarizing what the indicators are suggesting.
Oscillators
Neutral
SellBuy
Strong sellStrong buy
Strong sellSellNeutralBuyStrong buy
Oscillators
Neutral
SellBuy
Strong sellStrong buy
Strong sellSellNeutralBuyStrong buy
Summary
Neutral
SellBuy
Strong sellStrong buy
Strong sellSellNeutralBuyStrong buy
Summary
Neutral
SellBuy
Strong sellStrong buy
Strong sellSellNeutralBuyStrong buy
Summary
Neutral
SellBuy
Strong sellStrong buy
Strong sellSellNeutralBuyStrong buy
Moving Averages
Neutral
SellBuy
Strong sellStrong buy
Strong sellSellNeutralBuyStrong buy
Moving Averages
Neutral
SellBuy
Strong sellStrong buy
Strong sellSellNeutralBuyStrong buy
Displays a symbol's price movements over previous years to identify recurring trends.