Is it almost time for a retest? bull market in effectThis crypto has had some insane price action the last few weeks, I missed all of it unfortunately and been burnt several times. I hate this coin with a passion lol... but if we get a break up, it could atleast retest previous structure.
ATOMBTC trade ideas


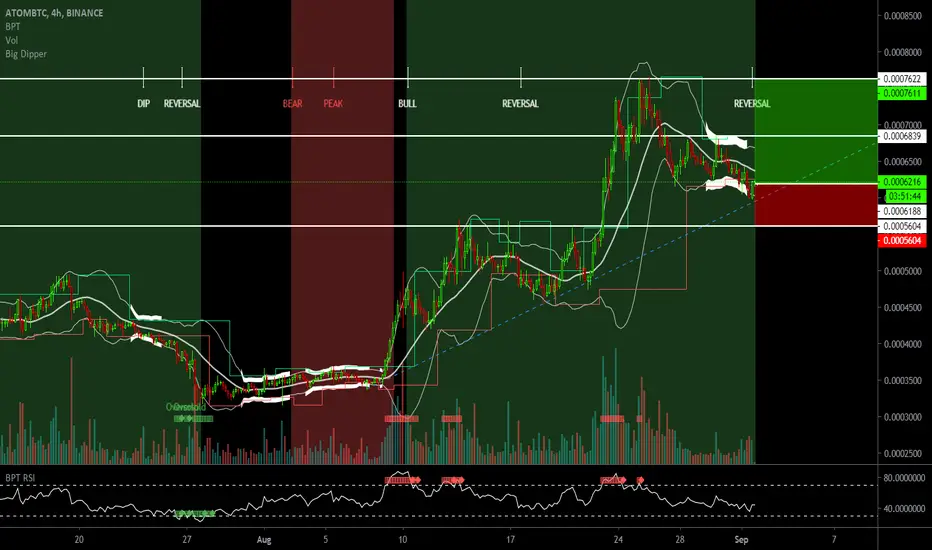
ATOMBTC - Long - Potential 23%ATOMBTC - Long - Potential 23%
Entry - 6221
TP1- 6839
TP2 - 1423
SL- 5604
Please comment with thoughts and how you get on.
If you like the idea, then hit like on the idea & support with a follow.
Good luck out there!

Cosmos (ATOMBTC) Cosmos (ATOMBTC) has developed good run and current rank is 16 and soon will place in top 10 in Coinmarketcap.
its newly listed in March 2019. It might compet with LTC for position in top 10 by end of year.


ATOM Cup&Handle breakout confirmedATOM Cup&Handle breakout confirmed.
Chart patterns tends to be fulfilled when found along with trend-line breaks.

ATOM.BTC (Y20.P3.E2).Gems in the making. No.5Hi All,
I have come across ATOM\COSMOS and have not payed enough attention to it, as it should and hence this post. (F chart)
Continuing on with the Gem series base on my previous posts, basically calling out charts that over performed, given parabolic curves.
Atom with its pairing has given us a beautiful structure it is which fits perfect into Corrective Wave triangle patterns, along with Bump and Run (BARR) strategy.
Having said that, this structure is easy to read and the targets are easier than others to identify.
Since its hit my 1st target (although I don't have Atom), Target 2 is clear and Target 3 as well, which has confluence with the BARR approach and fib extensions levels.
Using the height descending, top declining, bottom flat triangle, Target 3 is deduced.
How to trade this?
BTC is still feeling out the 11500 range and its my opinion that it won't hold, and hence ATOM\BTC will do a pullback from its 1st target, to the described red line (chart below), maybe even lower.
That's the time to enter and go long.
Please give me a tick or like for this post.
Cheers,
S.Sari
Overview of structure and targets: BTC pairing
ATOM/USDT

Here I go long on Atomic Coin and ATOM will go upHere I go long on Atomic Coin and Atomic Coin will go up The price is testing the major resistance, so now I go 5x long and the bullish breakout will start And Atomic Coin will go up No targets folks, I will only close all these longs in the next bull season.
See you up there


#ATOM BTC Breakout Now We expect good growth for #Atom in the coming weeks
Buy between : 0.0003161 - 0.0002938
you are free to Take profit
Stop loss : 0.0002540
Don't forget to support the post by clicking the like button
These are some of the profits from last month's deals
#DOCK +25%
#AMB +63%
#KAVA +66%
#ANKR +45%
#TROY +65%
#BQX +50%
#STX +37%
#OGN +21%
#POLY +70%

$ATOM, Crossing over ~51k sats w/ nice volume levels & UCTS buy!$ATOM
Crossing over ~51k sats w/ nice volume levels and UCTS buy signals across the timeframes...
Looking for a flip at the 12H/1D timeframes as signal of continuation toward ~60k/66k sats
EMA50/200 showing a golden cross on the 1D chart as well.
#ATOM

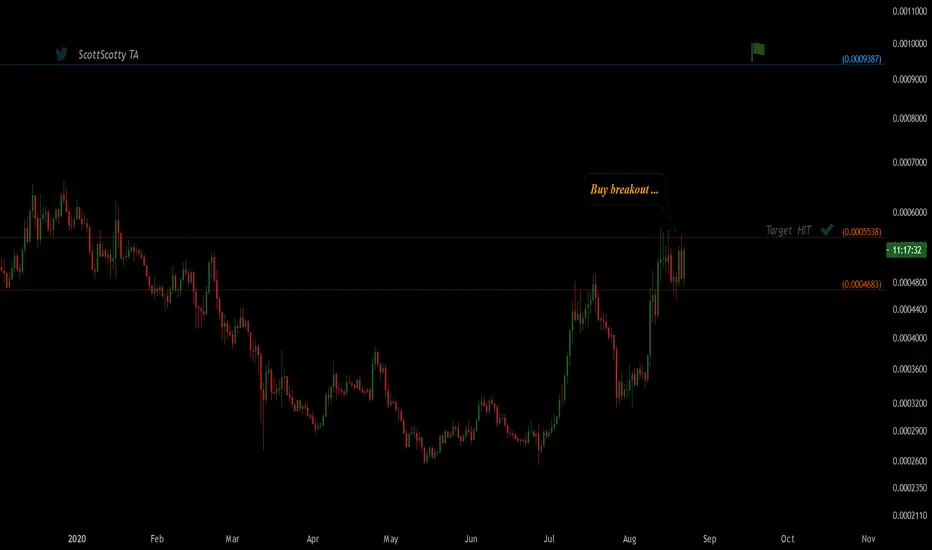
UPDATE: ATOMBTC now 102% profit as predictedATOMBTC has now hit our final target completing a total of 102% profit from our first entry.
ATOMBTC can still go further so we will update on a potential re-entry.
For now, enjoy with good profit.
If you like my analysis please LIKE this post and FOLLOW me from more cryptocurrency updates


UPDATE: ATOMBTC now 67% from our entry.ATOMBTC has now reached our third target and 67% have been booked.
Enjoy guys.
4th target incoming.
If you like my analysis please LIKE this post and FOLLOW me for more cryptocurrency updates

ATOM.BTC(Y20.P3.E2).Breakout from Macro structureHi All,
~~~ a continuation from the previous post, link below ~~~
Another one I have had my eyes on but with all the things that were happening, I missed the bottom but how many trades can you take?
Having said that, I missed out because I had others on the go and in some cases better trade setup.
Having said that, today's list is shorter and this one stands out for going long.
Observations:
================================================================
> On the daily, indicators are bullish (eg MACD where the macd line and signal are wide).
> The macro structure is a of Descending (top declining, bottom flat or bottom rising and with a breakout (reversal structure)
> 12 HRLY looks good with the indicators and candle sticks
> 30 minutes we had 2 touches to retest the resistance line (chart below) which was the inverted barr target
How to trade this?
> wait for consolation below the current resistance line and look for a bullish candle on the 4 hrly or 8 hrly
> refer to my 30 min chart with the 21/34 ema
30 min. chart > we had 2 touches to retest on the resistance line
Please give me a like or tick for this post.
Regards,
S.Sari
8 HLRY chart with clearer overview
DAILY chart > macd and WT indicators crossed over for bullish turn
4 HRLY chart, looking for another retouch and hence place your orders there
PREVIOUS POST


