ATOM / BTC - more upsideTop of channel not reached, pullback to mid range, some sideways movement and then up, it is making crazy moves so hopefully it continues with rest of market.
ATOMBTC trade ideas

ATOMBTC BEST ANALAYZE FROM A TO ZATOM MUST TO STAY IN GREEN CHANNEL AND CLOSE 1 DAY INSIDE NEXT CHANNEL YELLOW COLOR TO CONFIRM SIGNAL TARGET AND TRADE WILL BE ACTIVE AND TARGET IS 0.0007862
IF NOT and break green channel and stay inside blue channel IT'S MEAN trading terminate and not be active
disclaimer : my analysis as elliot wave with fibo retracement tools and chanel technical analyze so i do all my best to everyone take profit with out any lost money .
so make trade under you responsibility . good luck for all

Atom is about getting ready to go to moon!!!if we break 4742 levels and stabilize his move at this level we can see tp that I add in the chart.


daily analysis of ATO/BITCOINHi friends
the daily chart of this market shows that it will experience a downtrend in the next few days but at the same time you have to be vigilant of the change towards the opposite direction
please subscribe to receive more analysis

ATOM.BTC and USDT (Y20.P3.E1). Waiting on the support levelHi All,
(ref > A.Charts)
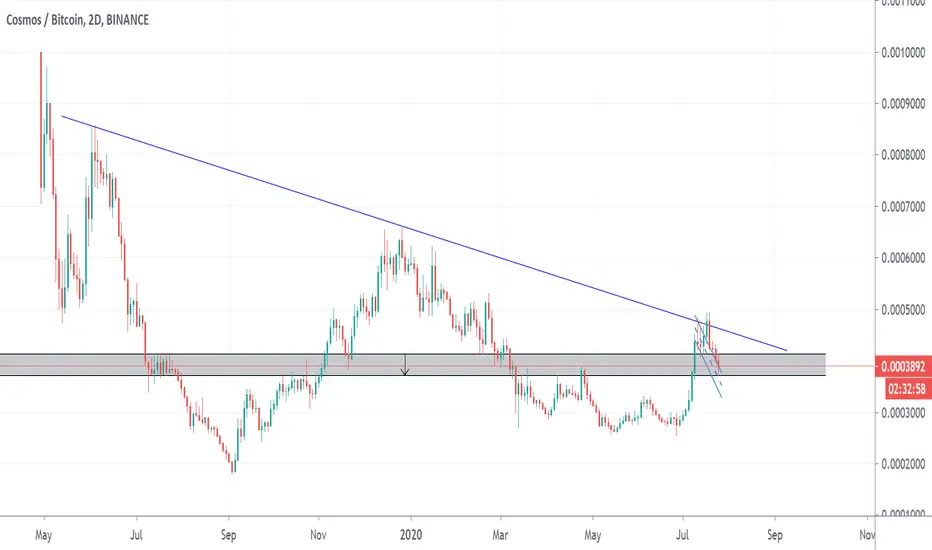
COSMOS (ATOM.BTC) is looking easier than most charts to read and hence an opportunity.
I have 2 possible scenarios\entrance points but for now, its heading down with clear downward pressure (based on a 2 Daily chart and its indicators).
The chart basically demonstrates that its looking for the bottom, either double bottom or the bottom trend line.
Similarly for ATOM. USDT pairing. We have 2 options or scenarios.
Please give me a tick or like for this post.
Regards,
S.Sari

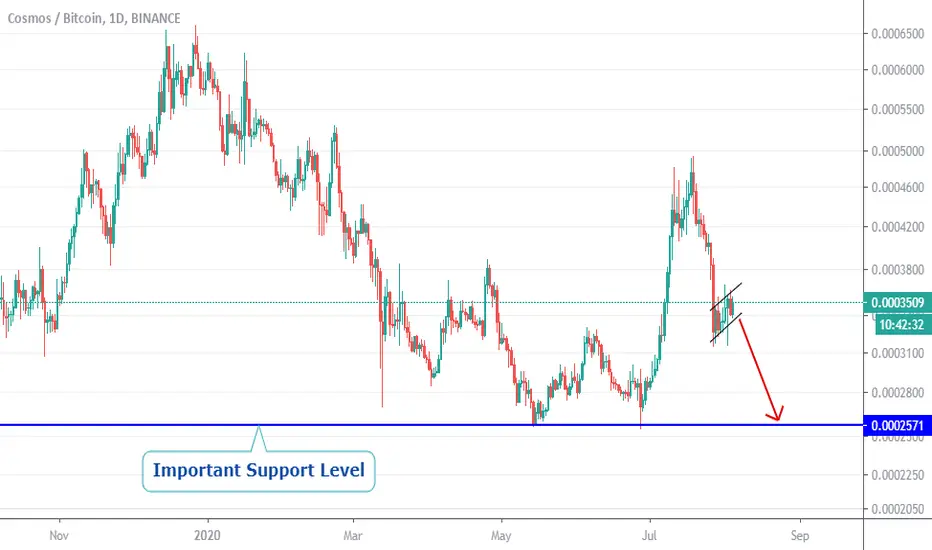
Bearish Accumulation on ATOMHello, traders.
ATOM is forming a Bearish Accumulation pattern called a Bear flag. The target is the next important support level.
A bear flag pattern is constructed by a descending trend or bearish trend, followed by a pause in the trend line or consolidation zone. The strong down move is also called the flagpole while the consolidation is also known as the flag.
The bear flag pattern comes after a strong move downwards. The stronger the movement, the bigger the profit potential is.
After we identify the market trend and the characteristics of an excellent bearish flag pattern, we need to wait for confirmation that the trend is about to resume.
There are two basic approaches to enter the market with the bear flag pattern. Aggressive traders will enter at the top of the bearish flag as this will secure a little bit of more significant profits.
Best regards.
Sando and Gustavo.
ATOMBTC is going UPI see the opportunity to BUY ATOMBTC
it is going up to 3692 zone
I think this trade will be awesome
If you like my signal please help to like and follow
Thank you


$ATOM Imperial Star Destroyer Ready for Take offLong here, close if the middle line breaks, long again 2x on the bottom line. Huge upside, limited downside. Target - new ATH with a blow off top on weekly.

COSMOS ATOM-BTC LONG$ATOM had a nice breakout recently and looks like it’s forming a bull flag!
Could ATOM be the next multiple X gainer like LINK, REN and RLC?

ATOM/BTC (Key Support @ 3200 Area)ATOM/BTC
-The price has dropped over -36% from the High at 4950 sat range
-ATOM may have found support at previous key areas on 3229 sat
-If this level will hold for the next 5 days or so
-It will likely to go up and retest the 3897 region
-The 3800 regions if the new potential area of rejection
-Bearish scenario, break below 3200 will lead to Swing Low retest

ATOM/BTC Another alt primed upRetest looking good. Bullish signals on short time frames. If we hold I see ATOM doing a big pump.
I'm layering into this trade now.

ATOM/BTC is forming a BULLISH DOUBLE BOTTOM !ATOM/BTC is forming a BULLISH DOUBLE BOTTOM !
There is also news at the end of this month.
Let's see if ATOM will make a move..
BTC must behave for this pattern to play out..
Trade safe my friends...
BINANCE:ATOMBTC

ATOM/BTCThis kind pullback to the strong support on the HTF doesn't always happen. With the upcoming IBC release, which is a milestone of Cosmos, it's worth to start building your mid term trade here.
Note: If you like the content and the setup, please give me a follow not to miss out on many altcoins charts to come.
Cosmos Trading PlanHello Traders,
Cosmos maybe started an correction from an impulsive movement. It would be an good opportunit to buy if it does an pullback to the 618 of fFibonacci for a wave III. We recommend to open position if it does a revertion candlestick pattern on that zone.
Please push like button and subscribe.

ATOMBTC UPDATE: ATOMBTC now 37% from our entryATOMBTC has reached two of our 4 target and we have booked 37% profit from our entry.
ATOMBTC is currently trading at around 4283 satoshi which is considered a support level since it acted as resistance in the past.
Traders can consider open a new trade from this level.
More room to grow for ATOMBTC but bear in mind that we might see some healthy correction.
Hope you followed and earned up to this point.
If you like my analysis LIKE this post and FOLLOW me for more cryptocurrency updates

ALTs.BTC (Y20.P3.E2).Stalking listHi All,
Here is some of my stalking list of coins and my short term view, opportunities that I'm stalking.
ATOM.BTC
Daily
CND.BTC as per the chart above > 8 HRLY chart
XLM.BTC > 8 or Daily chart
Daily
FET.BTC > stalking as well
Daily
AION.BTC
Daily
FTM.BTC
ZRX.BTC
LINK.BTC
ADA.BTC
XTZ.BTC
NEO.BTC
VET.BTC
DASH.BTC > potentially the bottom
ONT.BTC
KAVA.BTC
BNB.BTC

ATOMBTCPossible 4th wave correction soon. Chance to re-enter on its completion and buy the 5th wave. Good luck. Not advice.

$ATOM, 50% up over last week on a vertical movement...$ATOM
50% up over last week on a vertical movement...
Volume has been 🤯
Retests are for longs, careful fomoing without a proper SL
#ATOM

ATOM Breakout Setupprice is forming symmetrical triangle on daily and also at big resistance on daily time ..
We will focus on this breakout and hold our atom for big rally.. this 6 hour chart is very important for dip entry


