Retrace or Rocket upPotentially a small double bottom formation. Looks very similar to what VET was a few days ago.
ATOMBTC trade ideas

ATOMBTC is over boughtOverbought, a very high likely hood that this is unsustainable. Short!
I've highlighted 2 targets and a stop.

Missed the boat on ATOM? Please feel free to comment or challenge me on my TA. If you like my idea, leave a like to show support.
--------------------------------------------------------------------
Did you miss out on the ATOM bull run? Not to worry, you'll get another shot soon. Just be patient. No need to rush into this crazy market. People who rush lose out. People with a plan will prevail.
ATOM setup:
- Hit a daily resistance level at 4297 sats
- RSI heavily overbought
Look at the history of the chart:
- Last time it was in an overbought area, we were trading above the 200-MA (as we are now) and retraced towards the 50-MA and 50% RSI level
- Every time the RSI went above the 50% level, price rose
Game plan:
- Wait for a retracement to the 50-MA and the 50% RSI-level and take an entry there.
- Targets will then be: the weekly (white) or daily levels on the chart.
Good luck
*No financial advice, just my personal opinion.

Atom Btc - correction pending?Very explosive impulse up, ran into resistances but needs to cool down prior moving up as we spot a 4hr strong divergence on RSI.
Quick short for correction to 0.618 at least but keep in mind move up in BTC will bring confidence in alts and it will continue running up.

ATOM massive double bottomPlease feel free to comment or challenge me on my TA. If you like my idea, leave a like to show support.
--------------------------------------------------------------------
- 14-month long double bottom
- Broke through two weekly resistance zones
- Two big green candles
Targets:
Weekly resistance at 5177
Weekly resistance at 6315

ATOM/BTC in a bull marketATOM just broke an important resistance level at 0.0003887 and thus made a higher high on a daily chart while also breaking above the 200 daily moving average. The resistance has been perfectly retested on the 4h chart. Mid term target is at the previous high at around 0.0006600. Definitely bullish on this one ;)

ATOM / BTC #ROCKETBOMBQUICKIDEAHello!🧡
Continue a new hashtag #rocketbombquickidea for you🔥🔥
If you like such format of my quick analyzes, support me with like. I'll try to find more opportunities for making 💰
Always in touch with you🧡
Sincerely Your Rocket Bomb🚀💣

#ATOM - just like #VET going to #cosmos!missed VET -
DON'T MISS #ATOM!
Forming the same pattern, double bottom & trading inside a descending triangle, I am not sure which trendline resistance to follow so choose yourself either red or white dotted
#notfinancialadvisor
#DoYourOwnResearch

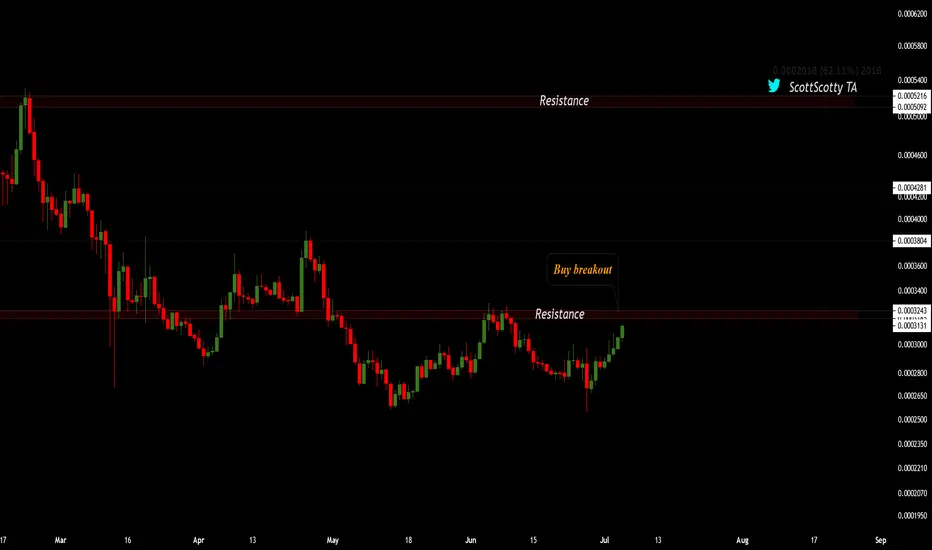
ATOMBTC Opportunity for 100% potential profitATOMBTC has broken out large resistance trendline.
Traders can open a trade at current market price but bear in mind that we might see some retracement after the price hits 3231 satoshi.
3231 satoshi is a resistance level and so we might see some retracement from this level. Above this resistance, ATOMBTC will head towards our first Target.
Entry: You can either open a trade at the current market price or wait for some retracement.
Target 1: 3811 sat (around 23% profit)
Target 2: 4283 sat (around 37% profit)
Target 3: 5196 sat (around 66% profit)
Target 4: 6309 sat (around 102% profit)
Stop Loss: Personally i would place a stop loss below 2900 satoshi. But it is your choice depending on how much you can afford to lose.
PS: Target 1 is a strong resistance level since it has acted as resistance in the past + the 200 EMA is around that level which acts as a dynamic resistance.

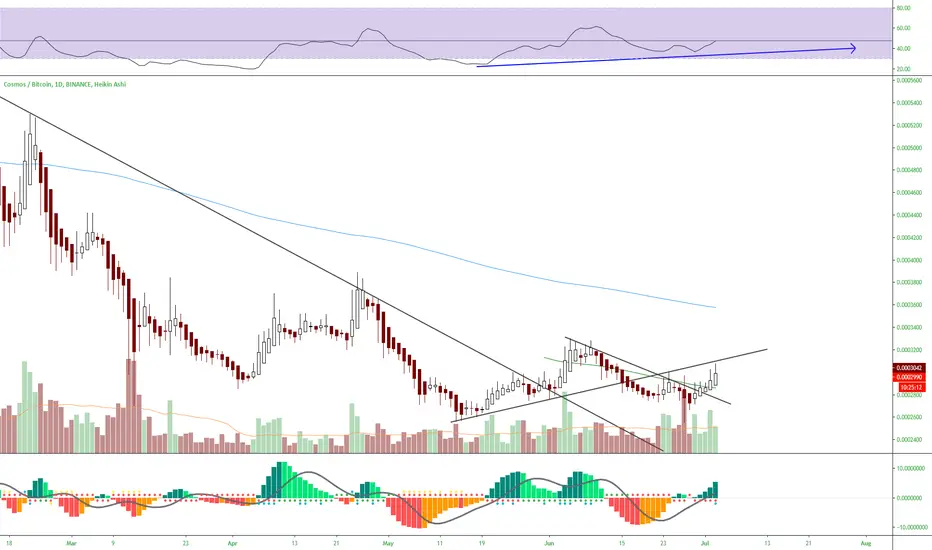
Cosmos Atom BTC is Ready NowBINANCE:ATOMBTC has clearly broken out of down trend and W Bottom pattern.
Conquered main hurdle of EMA200 now testing EMAA300 (grey line).
Volume is looking impressive with Ichi Tk Cross and kumo twist is taking action.
Rsi is Bullish Macd is bullish while BINANCE:ATOMUSDT is already bullish .

20% Bullish Move on ATOM A Possibility...I've seen this exact formation play out on a TONNE of alts this year and this is a real bread and butter trade set up for me.
We've got a W pattern inside of a larger W pattern and some nice upside potential as indicated by our VPVR, Ichimoku and EMA fan.
The first hurdel for ATOM will come ar this 3100 level and the 50ma, where we could see a break and retest, before another up to the 50/61 fib around 3400+ sats and the 100ma.
Don't want to get too excited about this, but 4000+ sats very much on the cards with the ATOM Stargate first testnet on July 27.
PLEASE LIKE AND COMMENT IF YOU'D LIKE TO SEE MORE ALT CHARTS!!
Have a great day friends :)
- Tex

ATOM confirms larger structure to solidify trend reversalCosmos (ATOM) has been trending down since peaking in December 2019.
After sliding into the RLZ and trading around the .786 on bullish MACD divergence. Price has now confirmed a smaller and this week a much larger bullish market structure to confirm a trend reversal.
Dips in the event of Bitcoin volatility should be considered buying opportunities until further notice.
Watch for price to trade up into the Gann 50/50 level later this month and potentially much higher, pending market conditions throughout the summer.

ATOMBTC | Key Level | Double Bottom | Trend Reversal Todays Analysis – ATOMBTC – Consolidating at key support, an impulse move to structural resistance is probable as it continues to hold above the 200 EMA.
Points to consider:
- Pivot point (key level)
- Double Bottom/probable head and shoulders
- Macro trend reversal
- Volume influx
- RSI above 50
ATOMBTC trading at a key S/R cluster as it breaks and holds support above the 200 EMA, attempting to break bullish. Body candle closes above this zone, an impulse move to structural resistance is probable.
A bullish continuation from this level validates a double bottom pattern. An S/R flip retest of daily support will form a left shoulder for a probable head and shoulder pattern and also form a higher low on the chart (indicating a macro trend reversal).
The recent influx of volume coincides with bullish price action, adding substantiality to the move. Volume must remain above average to maintain a continuation and avoid any fake-outs.
RSI and stochastics trading above 50 validates strength and momentum in the immediate market: oscillators need to range above 50 to maintain the bullish bias.
Overall, in my opinion, ATOM needs to hold daily support to increase the probability for an impulse move to structural resistance.
If you’ve read this far - thank you for following my work!
And as always,
Focus on you, and the money will too!

Cosmos (ATOMBTC) Breaksout, Next Target Mapped (Easy 59%)One of the strongest signals to look for is the trading volume... See it here rising on a daily basis on the Cosmos (ATOMBTC) chart.
As the volume rises we see each resistance being taken out and now we see prices trading above EMA100 (blue line).
This can lead to additional growth.
These articles might sound repetitive, but we like to keep it simple and the system we use tends to work.
The MACD is above zero, the neutral/centerline, which we call the bullish zone.
The RSI is above 50, which we call strong.
At 69, the current value means really strong.
ATOMBTC can easily continue to grow.
The next target is marked on the chart.
Namaste.
Previous chart from 1 month ago (Bullish divergence) | June 3

ATOMBTC Nice breakout 🦐ATOMBTC Nice
According to Plancton strategy, we can set a nice order
–––––
Follow the Shrimp! 🦐
Here is the Plancton0618 technical analysis, please comment below if you have any question.
The ENTRY in the market will be taken only if the condition of Plancton0618 strategy will trigger.

Cosmos ( ATOM )/BTC Very Bullish setup, longs in play...Hi,
daily chart looks very bullish , also taking into the consideration overall positive sentiment around, there is a possibility to see nice upside move, where risk reward ration is on the buyers side:
Buying dips between 3150/3000
Stop two consecutive daily close below 2870
First target 5000
Second target 6900/7400
Good Luck

$ATOM - major trend reversal on weekly chart- notes on chart
- it's a steaming buy at these levels
- RR is absolutely stunning
- keep a stop loss of 15% from these levels


ATOMBTCBroke out of down trend.
Consolidating and ready to go
With KAVA and BAND helping with cross-chain functionality and them also breaking out, I'd expect the ATOM price to reflect the on-chain value.

ATOM / BTC Trade IdeaWith the upcoming STARGATE Testnet news of ATOM due jor JULY 27th, ATOM value against Bitcoin might show some major moves upwards. Price is trying to approach the 200MA which usually ends up with a catalyst move upwards. Set your alerts on TradingView of the break of walling wedge and let it run.

ATOM/BTC#atom $atom
breakout occurs, Target should be below 20% from the next resistance.
And buy again when the resistance 32400 break.
#Goodluck
