BTC Pairs To watch out for in July(3-8weeks SPOT Trading ATOMBTCCatch the Cryptos In play before more dump from Bitcoin, because BTC falls always lead to the rise of most Altcoin BTC pairs shine shine. In July we will see coins pairs like ATOMBTC coming to alive and here is why...
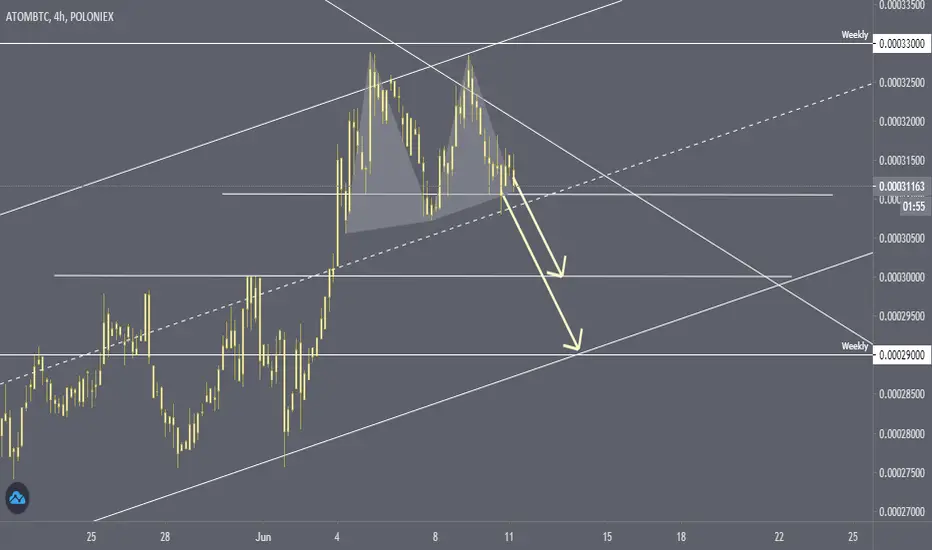
"Gartley" pattern from ATOMBTC daily chart.
after an XA "swing" the B level
was formed near 61% of XA.
C swing was formed at 0.80 AB range.
this "Gartley bearish pattern is
completed when AB =CD is formed at D.
I expect a retracement to the 0.000275 zone that will propel it to the expected Targets.
(Obviously the on this analysis is based on a daily chart, so we should expect to take this on s SWING trade aspect as this might take longer time from take up to 4 - 12weeks to achieve a good profit on most BTC Pairs and this won't be any difference.)
Thank you for Supporting MFT with your likes, Do follow us for more technical analysis updates.
ATOMBTC trade ideas


Cosmos potentialTrying to pick bottoms still lol
Neutral on this one, but it does look like bulls are slowly crawling back
The fib circle (4.236) can be seen to have broken


ATom/BTC, des signaux dans les 2 sens mais sur supportATom/BTC, des signaux dans les 2 sens mais sur support

ATOM LONG IDEAPrice broke through previous resistance, making a new high and is now pulling back.
Price already reached BZ1, i'm comfortable filling orders down to BZ 3 with the expectation
that this is a bullish pullback, targeting TP 1 & TP 2. In my opinion price would need to
pull back to take out the Major resistance level but when that time comes we'll see.
Trade offers very nice RR, additionally Atom has reclaimed a major support level and is
making Higher Lows

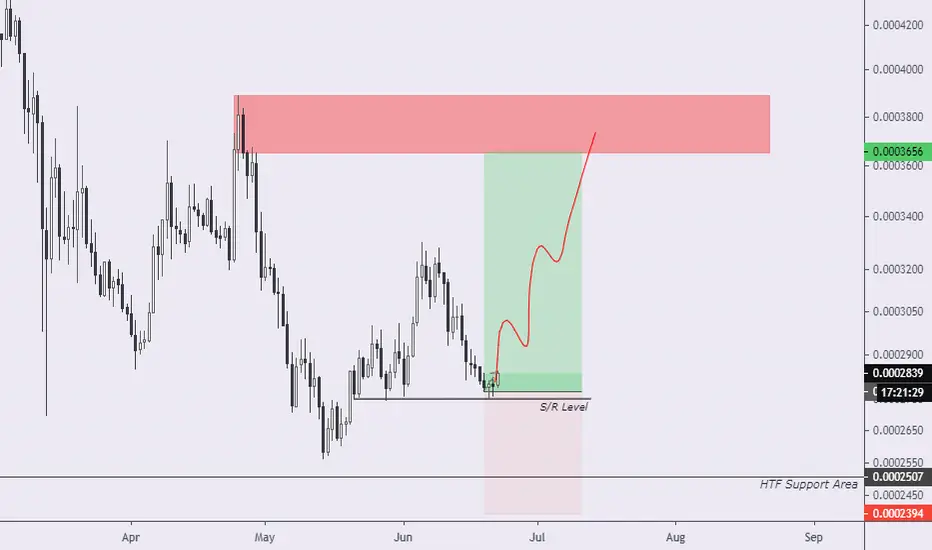
$ATOM/BTC - Long Atom has tested this S/R level near 2750 and price reclaim it pretty good and now moving up slowly. This is a slow pair, but a good point to long it.
i will close it if Daily Close below this S/R level. otherwise keeping this swing long till HTF Supply zone. targets 3200 - 3450 - 3655
ATOM/BTC LONG IDEA
#ATOM/BTC at 0.0002795 sat
Entry 0.0002800 - 0.0002750
Support: Bottom Pink Line and 0.0002560
Resistance: Top Pink Line and MA100
If it breaks the resistance it will go around MA100.
It could be a re/entry at confirmation around 0.0002800 - 0.0002900 sats
It's my first post.
It'll be nice if you leave some comments to improve my charts and publications.
This is not to take as trading idea. I'm still learning. Do your own analysis.


ATOMBTC - 60% GAIN FOR HODLERS - LONG TILL MID JULYBig reversal happening soon.
Should make it bach in the 0.0005 by mid-July, .
Could I do this trade? hell no, can't wait this long Ill explode,
Holdlers? can this be worth it? you tell me?

ATOMBTC bottom is in?ATOMBTC has broken the resistance, bounced on the trendline, currently retesting the resistance becoming support. If it hold, it would have enough strength to break the trendline and start a new bulltrend.
Nice risk/reward here.

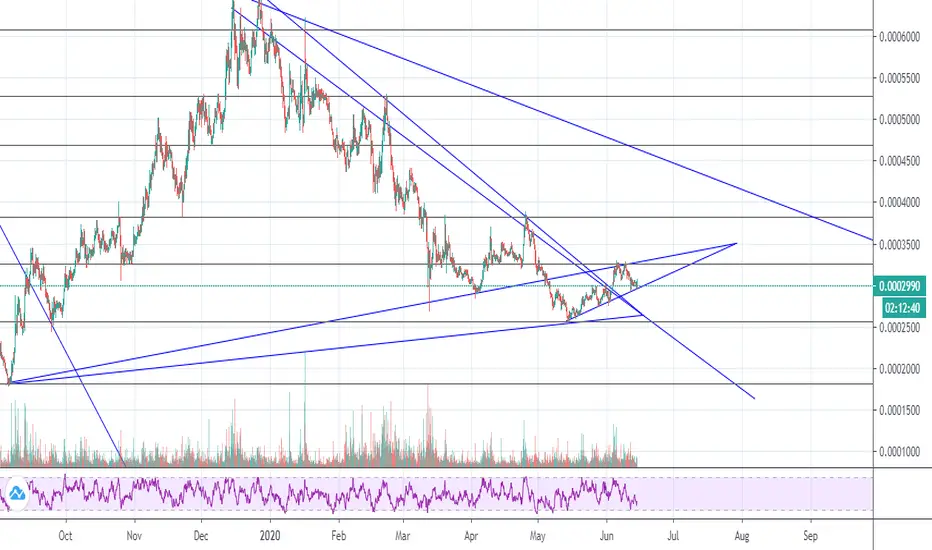
ATOM/BTCI'm unsure how I feel about the ATOM/BTC pair at the moment.
Looks like it has broken the downtrend from the previous cycle, but overall, it's still stuck in a downtrend from initial listing.
Forming a rising wedge, which is technically bearish. Sitting at support on said wedge. If support breaks, 1850-1900 satoshis is possible. If it does get to that price, then it's an absolute buy for me as I'd be targeting a potential double bottom situation. I'm currently holding this, but I regret not selling at 3200 satoshis, which was a very clear double top (in retrospect).

ATOM Weekly Breakout | 100 % + potentialcoin is now retesting need good volume and good weekly candle close
waiting for perfect opportunity to grab this one


ATOM Momentum PlaySnap back to pre-Corona prices.
Didn't get a continued breakout.
Play the same strategy as BAND

ATOMBTC Hi
If you are holding this pair, I highly suggest you sell it.
Cause, as you can see in the chart, there Is a visible Double Top Pattern.
On the other hand, Price hit the static weekly resistance and has shown a reaction to the base trendline.
So don't Hold it yet.
If I could short this, I would.
------------------------------------------------
What is your opinion? Comment it below.
If you like the idea, please hit the like button and subscribe to the profile to not miss my updates. The information given is never financial advice. Always do your research too.
Goodluck.


ATOMATOM is on of the best looking alts offered on binance futures. I’m already long from 2986 and plan on holding this position for a while. WEEEKly is absolutely nasty 🆙📈

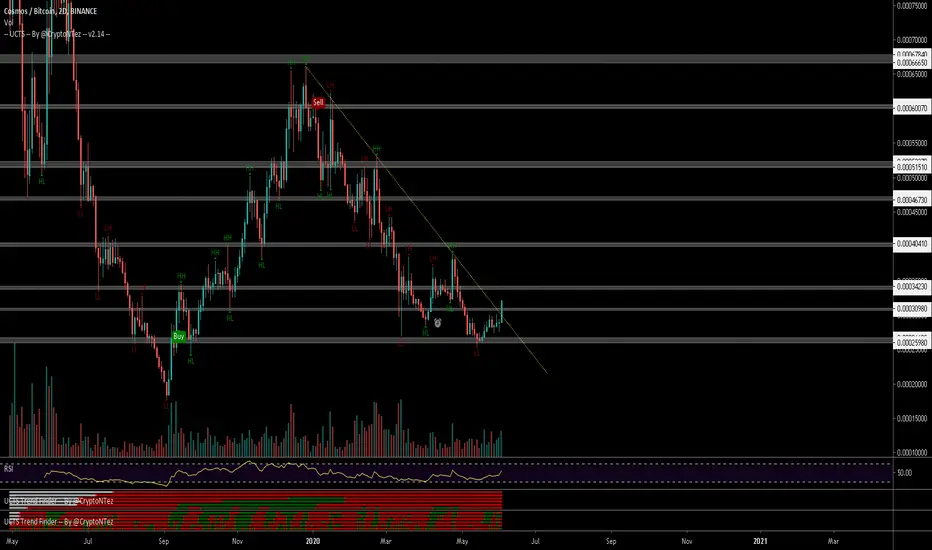
$ATOM, Pushing above ~30k sats level w/ increasing volume$ATOM
Pushing above ~30k sats level w/ increasing volume & UCTS Buy signals on the 1D & lower timeframes...
Aiming continuation from here toward~34k sats as 1st target...
Long descending trendline also breaking out...
#ATOM