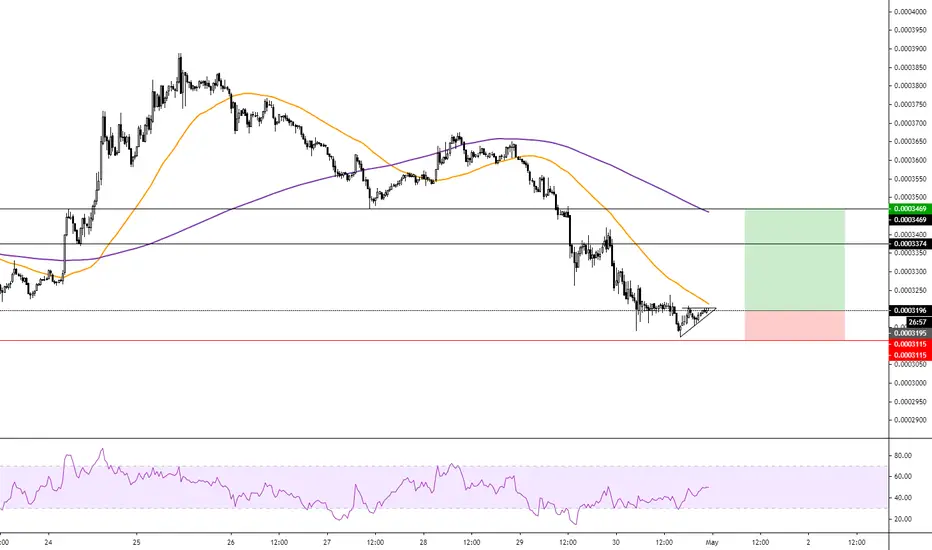
LONG - ATOM - Trading OpportunityBINANCE:ATOMBTC is another one that still hasn't made the comeback that it should, now in an ascending triangle formation in the lower time frame, while also hanging above the MA50 on the 15min chart.
Entry: 0.0003196
Target 1: 0.0003374
Target 2: 0.0003469
SL: 0.0003114
ATOMBTC trade ideas
ATOM buying opportunityFeel free to challenge me on my TA or share your own thoughts
Atom is holding this ascending channel
- Might drop down to the bottom of the channel, which crosses a strong weekly level (3349 sats)
- 50 MA might also meet the bottom and weekly resistance around that area
If it does not break 3349 sats I will be looking for a long
- Target: between 3809 and 4000 sats (two daily levels)
- Stop loss: 3238 sats (strong daily resistance)

Is ATOM forming a W pattern?Just thought it was an interesting formation for ATOM on both 1d and weekly time frame . But the formation will be cancelled for sure in case we see a huge dump in BTC again.
What you guys think?

ATOMBTCATOMBTC
Buying in the area 0.000354 - 0.00034
✅ 1 - 0.000376
✅ 2 - 0.000398
✅ 3 - 0.000430
Breakdown 0.00033, the price may fall below
If you like what I do, put 👍 and subscribe
Waiting for your comment, what do you think about this?


#ATOM/BTC Ready to BreakoutI will keep it very short.
This is no shitcoin.
This is a good volume coin.
ENTRY Price would be around: 3370 to 3430
Target: Marked in the Chart: 20%+
Stop Loss: 3230
I expect this one to play out well.
#Peace

ATOMBTC 3 out of 10 daily morning chartsATOMBTC
still in an overall bearish downtrend. At the moment in a 4hour sideways consolidation period.
historically box consolidations have entry - 2 top touches and big bearish movement.
the missed ideal entry into short, Darvas box entry could play out and a stair down.
Low 4hr volume, MACD looks to flip bearish, histogram looking thin, BB narrowing, RSI midway with now divergence.

ATOM/BTC Multi Timeframe Analysis [Quick Updates]Hey all, here’s another entry on my tradingview series called 'Quick Updates'.
We can see that ATOM has reversed its overall trend. We can use this information to establish a positive bias and add a certain upwards probability to each of our following trades. Currently we can see on the lower timeframes that the price is reaching a zone of horizontal support. This is a great opportunity for a long position.
--- What is The Quick Update Series All About? ---
I have started a new tag (quickupdates) where I quickly share great opportunities based on TA for shorter timeframes, such as 4h, 1h, and 15m. It will contain a brief explanation with clear and clean charts in order to keep the velocity up and make sure you get to see the opportunities as fast as possible.
Follow me for consistent high quality updates, with clear explanations and charts.
Please like this post to support me.
- Trading Guru
--------------------------------------------------------------
Disclaimer!
This post does not provide financial advice. It is for educational purposes only!

ATOM/BTC Bullish Chart Analysis#ATOM/BTC Chart Analysis:
ATOM current price is 3400 Satoshi.
looks good for enter in fresh setup.
I am buying here and My target would be 30%
If breakout above 3550 Satoshi then I can expect 3930 and 4391 Satoshi.
so
Entry: 3400-3420 Satoshi
Targets: 3930 / 4391 Satoshi.
Support: 3380/3250 Sat
Please like and follow me for latest crypto updates.
Thank you

ATOM BTC bullish targets3 higher targets, liquidate 1/3 of the position at each target.
The first target is the easiest with a cup and handle pattern and obvious reversal from the lows.
The 2 other targets are based on previous support and resistance levels, fibonacci and volume profile.

ATOM to 50% fibI wouldn't enter exactly here, as I don't trust this bull pennant, 70.6% fib seems more like a better entry, target tho, is certainly 50% Fibonacci

ATOMBTCFibonacci retracement and volume profile indicates high probability of going higher to the 50K sats area in the short term.
The volume profile at the current levels indicate high demand for the coin.


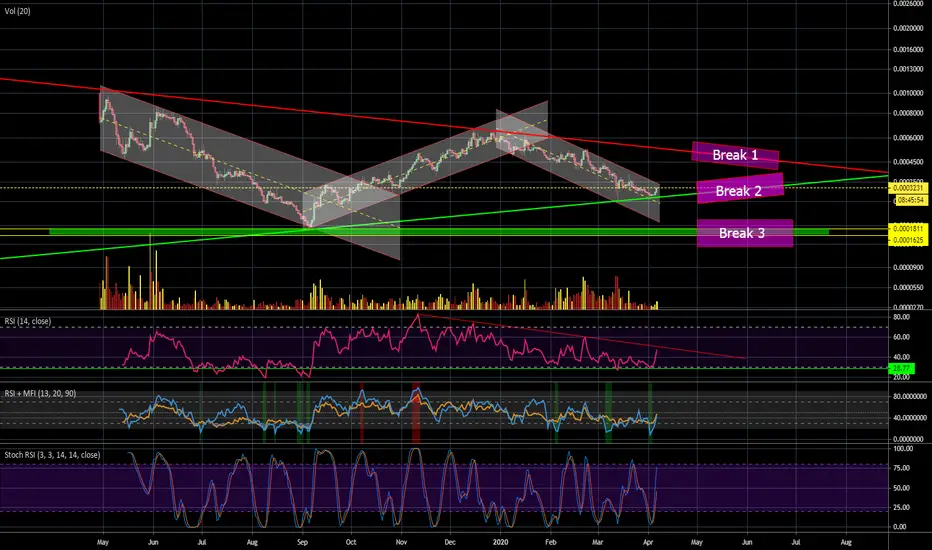
ATOM / BTC DAILY SHORTATOM short cut, ATOM Big triangle, inside there are some trading channels easy to see Pivot points:
* Breaking zone 1 would be realy bullish and make new highs!
* Breaking zone 2 We go longer side ways
* Breaking zone 3 would be realy bearish and making some new lows!
Keep an eye on this one mates!
ATOM/BTC - bull wedgelevel for which to hide the stop
there was a breakdown on the 1 timeframe:
if we don't keep it at that level.
We have a level 2543sat waiting for us.
Friends, thanks for your likes and comments!
Good luck with trading!


ATOM/BTC GOOD FOR BUYGiven the upward trend of indicators and the Kendall daily earnings of 10%, it is very appropriate

Descending Triangle on ATOMBTC - Price Can Break Soon!We need to be really careful here on ATOM/BTC. A very clear descending triangle is forming here, giving us very bearish signals.
The intuition behind a descending triangle is that there is a support zone at the bottom, with multiple attempts to break the support. After every bounce, the bulls slightly decrease their power. At some point the bears break through the support zone , and will create a sharp drop in price.
Follow me for consistent high quality updates, with clear explanations and charts.
Please like this post to support me.
- Trading Guru
--------------------------------------------------------------
Disclaimer!
This post does not provide financial advice. It is for educational purposes only!
About the links below:
20% Discount on Binance: Did you know that Binance introduced a new system where you can get 20% discount on your fees? Find the step-by-step guide on how to add it to your account on the website of 100eyes
Forex & Crypto Scanner: Nobody can keep track of all the pairs on all timeframes. This scanner works on Telegram and sends an automated message including a chart every time something happens to a coin. E.g. it can automatically detect areas of support and resistance, RSI Divergences, Fib Retracements, and more.
Recent success stories

