COSMOS * ATOMBTC time to buy some spot Chart looks like one big accumulation
That rounded bottom looks primed, ready to rip
Check cosmos.network
ATOMBTC trade ideas


Cosmos Breakout from Range - Possible Price MarkupAs part of my series of trying to pin down Wycoffian patterns, $ATOM caught my eye. In February ATOM made its first markup, where it then blew off the top. Price stayed suppressed under the volume-weighted average price. On the 19th, ATOM started a rally that sent it over to the VWAP. At the start of May, it saw a volume-supported rally, pushing it across the resistance.
In Wycoff cycles, the entry is usually done after the breakout retraces. I got in early, at around 5100, because I'm a FOMO beast. If the retrace makes a move up above the previous high, that is considered a good entry to ride the markup. Volume seems to be following buyers and price moves up while falling during bear candles.

Crypto|ATOM/BTC|LongLong ATOM/BTC
Activation of the transaction only when the blue zone is fixed/broken.
The author recommends the use of anchoring fixed the blue zone, this variation is less risky.
If there is increased volatility in the market and the price is held for more than 2-3 minutes behind the activation zone after the breakdown, then the activation of the idea occurs at the prices behind the activation zone.
The idea is to work out the resistance level .
* Possible closing of a trade before reaching the take/stop zone. The author can close the deal for subjective reasons, this does not completely cancel the idea and is not a call to the same action, you can continue working out the idea according to your data, but without the support of the author.
+ Maybe right now we will go even lower, then it's okay, the idea is not activated and simply canceled.
+ ! - zone highlighted by the ellipse is a zone of increased resistance, in this area there is a possible reversal for a correction, please take this factor into account in this transaction.
The "forecast" tool is used for more noticeable display of % (for the place of the usual % scale) of the price change, I do not put the date and time of the transaction, only %.
Blue zones - activation zones.
Green zones - take zones.
The red zone - stop zone.
Working out the stop when the price returns to the level after activation + fixing in the red zone.
Orange arrow - the direction of take.
Black arrow - neutral scenario without activating the trade.
The red arrow - the direction of the stop.
SUM PNL: This parameter displays the total % of all closed ideas of the "new" format (according to the author) for this sector at the time of publication of the idea. The calculation is very "clumsy" just the sum of the profits of all the ideas, based on this indicator, you can more accurately assess the risks when working with my ideas of this sector. I present you the construction of the idea, you can use it yourself as you like based on your subjective view and risks, the calculation of the PNL indicator is carried out only on transactions that the author closed on TV in manual mode or by take.
P.S Please use RM (risk management) and MM (money management) if you decide to use my ideas, there will always be unprofitable ideas, this will definitely happen, the goal of the system is that there will be more profitable ideas at a distance.


$ATOM, Crossing above ~46k sats level$ATOM
Crossing above ~46k sats level w/ UCTS 2D Buy signal (Usually strong)
Market is really bullish across the board so taking more exposure to more alts atm (risk on)
Next level to watch at YTD high (~54k sats) & ~65% toward '20 highs
Let see how it evolves.
#ATOM
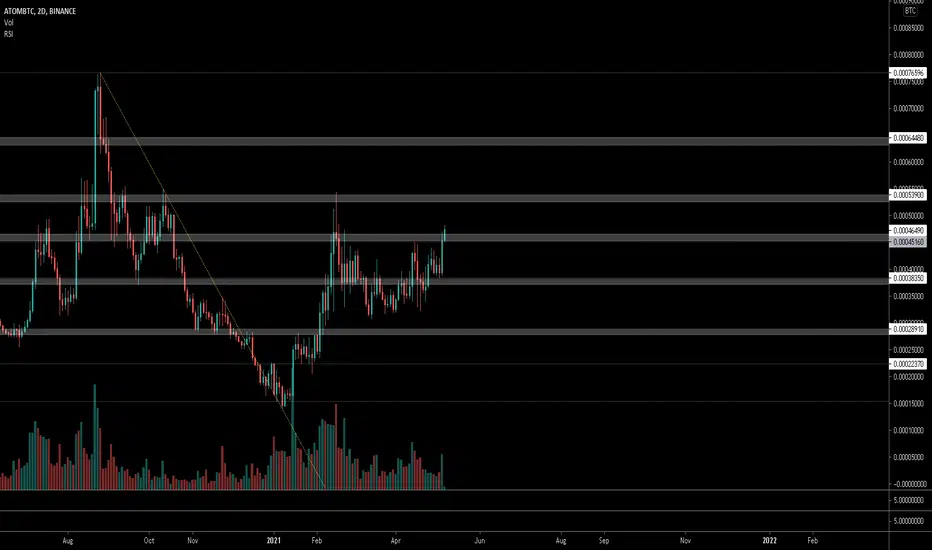


ATOM BTC KEY LEVELATOM BTC is at key level in the mid range between 2020 high and 2020 level. Looking for mid range holding support and going long towards 2020 high


Dump BTC ! Buy ATOM - Last change to get over 50% more bitcoin Bitcoin dominance is dropping.
Cosmos is going up !
Simple trade to maximize your bitcoin.


ATOM.BTC (Y21.P2.E1).Priming for a breakout tradeHi All,
ATOM\Cosmos against BTC is looking good and a consolidation is happening just under key resistance level.
2 Strategies here.
a) Buy zone on the concentrated daily 10 and 20 ema level
b) Buy on the breakout of this resistance trend line.
All the best,
S.SAri


Cosmos / Bitcoin in a bullish movement by Rocket bomb D1Hey traders how are you feeling, there is some formation in the crypto market for you. ATOM / USDT is in a symmetrical triangle which is about to breakout following the bursting of resistance. The piece can rise sharply on the rise in other of the movement (A, B) for (C, D). The divergences on the MACD and RSI indicators which confirm the movement of a bullish continuation, it is necessary to wait more for the leak! To access the key resistance area. Enter optimal on breakout of it on the check for stance in the front breakout of control. In order to reach new price perspectives.
Please like and follow, thank you

$ATOM re-accumulating in the form of a symmetrical triangle $ATOM is likely re-accumulating in the form of a symmetrical triangle, will enter on the breakout📈


Atom/btcLowvrisk high reward! Hagopian rule ..based on spx500 expecting crypto push to new all time high.

ATOMBTC consolidation below resistance is bullishthe best tech in smartchains, no marketing
once people look a lil deeper (soon)
this thing goes vertical
OBV breaking out of downtrend hinting at breakout
RSI chugging bounced off trendline turning upwards
ATOM moon soon
