Bjorgum Levels explained with new short and possible bull targetVery common bounce from the bottom of the last bjorgum level at 25.6. This happens very very often, even on lower time frames, but when it happens on a larger time frame it gives more weight.
Since the bounce from the level, we have seen an exact test of the resistance level at 32.6 which matches May 3'rd's wick test of the resistance. This is such an important resistance level in the history of atom. IF we break above 32.6, it is almost certain we will test $40 again, which is the last untested level. I personally do not think this will occur, but it is the most bullish scenario. Keep in mind I shorted here at the $32 level.
There are currently only 2 bjorgum levels 25.6 (bottom of bjorgum level in trend) and $40 (absolute top of bjorgum trend before inputing longs of confirmed solid candle close above the $40 level.)
I have shorted the $32 level with a stop loss of $34.5
Good Luck!
ATOMUSD trade ideas

ATOM QUICK SELL IDEA FOR 050222My Opinion on ATOMUSD for quick sell profitable
Divergence m15 - m30 -h1
Fibo reach 423 for uptrend and need correction.
GOOD LUCK !

ATOM have bottomed: 8 reasons to turn bullish1) Atom completed a near perfect M-gartley pattern w/ a 1.63 retracement from neck & a 0.785 from low.
2) at uptrend line support
3) at Gann Fan line support
4) perfect 0.786 Fibonacci retracement
5) indicators coming from oversold & turning up
6) big green engulfing candle
7) Diamond reversal pattern may be forming
8)It went above dma200 & held inside the 29-30 horizontal pivot support zone
not trading advice

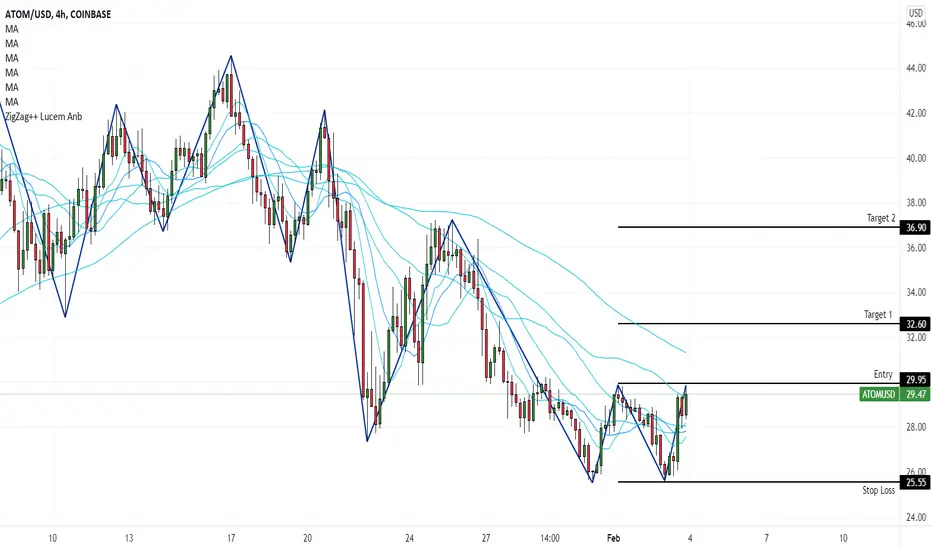
ATOMUSD (4H) Bullish reversalHi Traders
ATOMUSD (4H Timeframe)
Waiting for the upward break of 29.95 resistance level, which will complete a bullish trend reversal pattern to go LONG. Only the downward break of 25.55 would cancel the bullish scenario.
Trade details
Entry: 29.95
Stop loss: 25.55
Take profit 1: 32.60
Take profit 2: 36.90
Score: 5
Strategy: Bullish reversal
Neutrality remains the master !Prices are still under pressure, with $BTC which remains undecided and fundamental issues from central banks but also from inflation which continue to weigh on the markets.
To frankly confirm a signal, both prices and the 4h Lagging Span must break their resistance :
Weekly Kijun, at $28.7 for prices. This area is a major resistance and it remains important to close above (remember that only the Weekly Candle confirm the signal for this Weekly support)
On the same area, the 4h Lagging Span is blocked by the 4h Tenkan. This one must break this Tenkan to confirm a bullish signal, at least on a 4h Point of View (short term)
Let's see how it goes,
What do you think guys ?

Closing of the monthly candle tonight ! It is important, for prices, to stay above the Monthly Tenkan until the closure of the candle, in 12h now !
It would give a nice signal for the next weeks and would show that the bullish momentum isn't in danger, on a long term point of view.
Target to defend : $26.3
Target to look at, in case of base : $28.3 ; Weekly Kijun.
If we break this Monthly Tenkan: next important support : $22.9 ; the Monthly Kijun !

ATOM: Bull Flag PT $31ATOM has been weaker than it was relatively to last week but I think that is about to pivot back to strength. ATOM retraced from the ATH back to the 0.5 line which is a very healthy retrace to occur and usually signals the end of a bearish trend before a rise higher (albeit within context of BTC rising/stable).
ATOM has produced a bull flag with a PT to $31 - the high volume suggests this is an authentic breakout attempt

ATOM Short term perspectiveI see ATOM as being in consolidation and accumulation area. Time to accumulate until that bounce area that marks the multi-month trend line.
If that trend line fails, then accumulation continues and all bets are off.

ATOM/DOTLong ATOM, short DOT
long cosmos ecosystem
I'm looking for an entry and plan to hold the position throughout 2022

The $ATOM situation, before the FED. Just hours before the FED speaks, $ATOM is navigating on the lower side of its previous range.
After a retest of the low confluence zone, short has been activated after the H4 break down.
Now, 2 options:
1. FED is priced in -> lookout for a break up H4 to cut short position and wait on the sideline
2. FED is not priced in (aka bad news) -> acceleration of the downtrend, most probably, with TP1 & TP2 ready to be made
Just ideas, crypto ideas.

Cosmos Markup Cosmos currently has an $8.2 Billion Market Cap as of 1/29/2022 as well as $994.2 million in volume within the past 24hrs.

ATOM Cosmos: 1D Chart ReviewHello friends, today you can review the technical analysis idea on a 1D linear scale chart for Cosmos (ATOMUSD).
The chart is self-explanatory. Cosmos price is at the edge of an Arc Formation as well as around the 200D simple moving average. The RSI and MFI is at or near the support line. The last three daily candles look like Three Black Crows Pattern (bearish). Though price has potential to bounce back up, there is an upcoming red Ichimoku Cloud resistance as well as the overall crypto market downturn led by Bitcoin. If price falls below the 200 MA and outside the Arc Formation, expect a potential strong support at the multi-month support line.
Included in the chart: Trend line, Support and Resistance Lines, RSI, MFI (Money Flow Index), Ichimoku Cloud, 200 day simple moving average.
If you enjoy my ideas, feel free to like it and drop in a comment. I love reading your comments below.
Disclosure: This is just my opinion and not any type of financial advice. I enjoy charting and discussing technical analysis. Don't trade based on my advice. Do your own research! #cryptopickk

Another test of its Weekly Kijun$ATOM is another time testing its mid term support (Weekly Kijun), in this $28 area.
If this one breaks, we'll take a look at the lower support at $26.
A strong one is the area of $20, because we could see a test of the Weekly Lagging Span on its Weekly Kijun.
As a target, the 0.382 Fibo Extension is still the resistance to break.
And $54 is also a very good target that prices can easily hit if momentum come back !
Let's wait and see !


ATOM, looking for retestATOM has been one of the strongest looking coins on the market during this downward trend we find ourselkves in atm.
ill be looking for a long once we break through that overhead resistance.
She has good volume and the rsi is ready to bounce.

Possible COSMOS Short?Not financial advice. :D Always trade with knowledge.
When the fast (K) stochastic RSI (Blue Line) crosses the slow (D) stochastic RSI (Orange Line), I believe this could be a short buy signal for COSMOS. When this occurs, you can check if COSMOS is bouncing off a Fib level or the DailyMMA50 and if the RSI has an uptrend. I am currently looking at a $32.50 price target (0.5 Fib) later today or tomorrow. Have a great day, everyone! What do you think?

Can Take off SoonAllow price to break above $37 to confirm strength to stay in. 1st target is $49 and then towards $60.

ATOM showed incredible resistance during this crashIt's currently a very bad idea to rely on charts to predict the bottom or guess which direction the market is going to take. Macro is driving everything: probable war in Ukraine, Fed rates... However, charts do tell a story.
Over a long time frame, crypto is super mega bullish, but in the next weeks/months, there is a high probability of BTC dropping further, taking out weak alts with them.
Many alts are going to lose 90% of their value.
ATOM isn't one of them. It showed extreme resistance and did even grow significantly while everything was crashing. This is because the ATOM ecosystem is growing and showing a lot of potential.
If you look at the EMA the trend is clear. I slightly adjusted the lines from my previous analysis.
You can either buy now, or wait for it to drop a bit (which it will probably do in the next weeks), and then HODL for months and enjoy great returns. If you own ATOM already selling now is IMHO a mistake.
DYOR.

Scalping ATOMFirst time posting here. Let's see if I'm predicting this right. I'm buying at 32 to sell on 36.

Scalping ATOM.First time posting here. Let's see if I'm predicting this right. I'm buying at 32 to sell on 36.

ATOM has now retested both resistances and is a shortATOM has now retested both resistances and is shortable. Try to get an entry closer to 40, but if bitcoin continues its plunge, this could really really go as low as 31.5 and last profit point for the 5x leverage short will be 27.

A "Bull" Run for ATOM?There are a few Signs that ATOM is set for a new Rally in the coming Weeks. Is a new ATH in sight? Maybe!
ATOM did a perfect and successful bounce on the Fib. Golden Pocket @ 0.65 / 20.90$. The Golden Pocket often turned out to be a significant Level of Support or Resistance. As seen here, it held support two times, with a strong bounce back on the second test.
The Heikin Ashi candles are set for a Trend reversal, if you take a look at the MACD which is also reversing, an Impulsive move is on the Edge.
Keep in Mind, that the Altcoins still are very correlated to Bitcoin, and Bitcoin itself to some major Indexes like the DJI or SPX. If these Markets start to Correct, most likely ATOM will do the same. An entry can be searched after the MACD crossed Bullish and the Heikin Ashi Candles still showing an Uptrend.
If you like my Content, hit the 👍 and/or comment and make sure to follow.
This Analysis is not intended to be investment advice. Always DYOR.

It may be like Bitcoin and go downtrend #ATOM It may be like Bitcoin and go downtrend . what is your idea?
