ATOMUSD trade ideas
Cosmos, time has come?Atom has been trading side ways for a long time, and after the new update we might see atom pop off and do 2x in this all coin season. Iam looking forward to 40.


ATOM/USD: GOOD CHART&GOOD TARGETSSELL FOR 45$!
I used Fibo levels for calculating Waves based On Elliott waves theroy.
Hope you enjoy


ATOM breakout 12/04/21Based on these bullish flags and ETMs, I believe there is a good buying opportunity and predict there will be a big breakout of ATOM maybe later today if it accepts this resistance level at $23.60 but even if it denies it I do believe it has good long term potential. Only a beginner but regardless is not financial advice. Believe a lot in this crypto as it has good fundamentals, Yes it has a large market cap however I believe there is huge growth potential considering the applications and market it is focused on. Also to note, TYSON FURY is releasing a NFT collection so if more celebrates jump on NFTs there is defiantly potential for NFT CRYPTOs such as ATOM to grow.

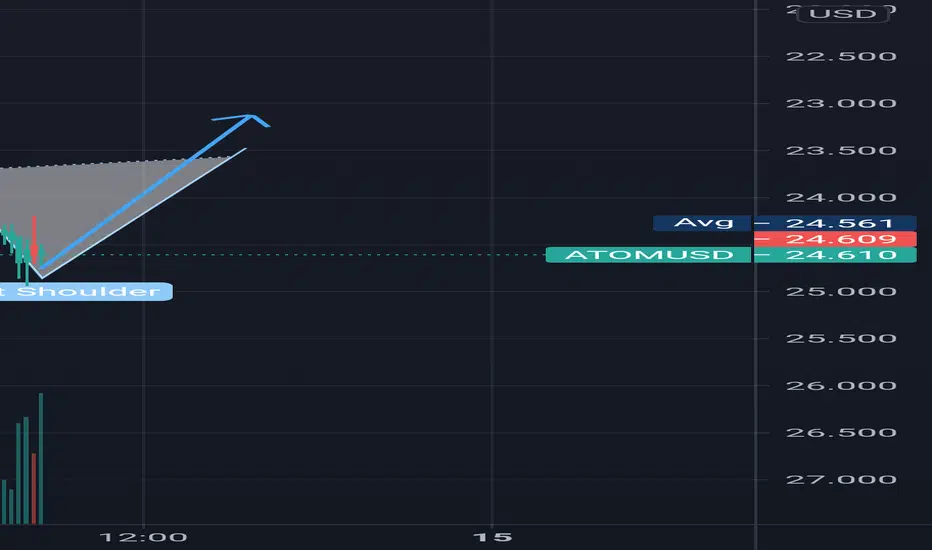
ATOM - 2 range forecast, whats up!?Hey,
This is how I see the forecasts on two different time frames... We have taken off with a harmonic pattern... one level higher than the forecast for the longer range (grey trace). That seems optimistic... though could be an exhaustion peak.
The shorter range forecast is looking good to imply exponential growth.... how far does it go??? Well, scaling the blue trace to the recent correlating pull back from this harmonic pattern deeper back in time, and into the screen, we get to see that the pattern has indeed stretched vertically... also implying exponential growth forces, and increased volatility.
If you want your brain to run faster, follow me and skip the sugar, alcohol, and mammal!
Good Luck!

Green Ascending Line BreakingOrange rising trend is strong. I'm confident to orange line. Some buying can be tried. The target is around $ 30.

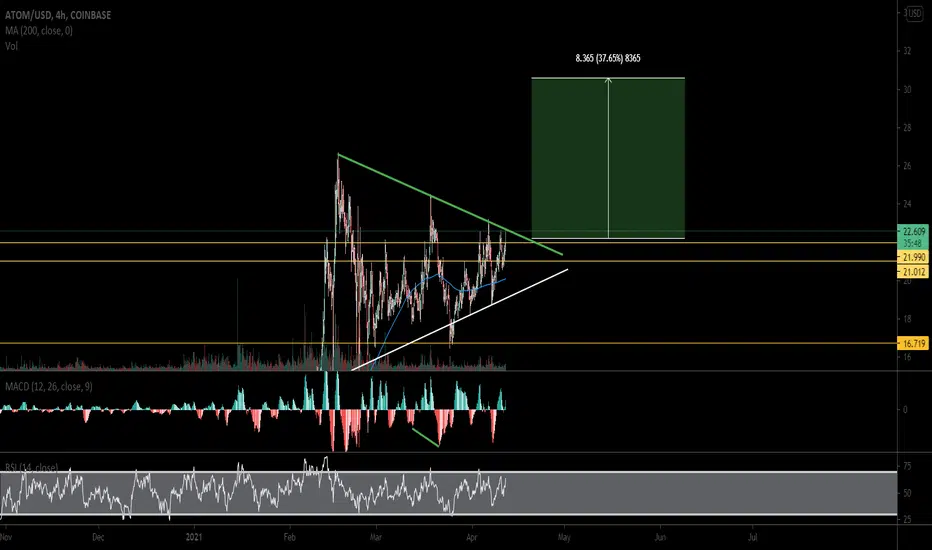
ATOM Very Bullish??It appears ATOM has broken out of a symmetrical triangle. It's backtesting the breakout currently and holding the .618 fib is key. 22.81 is a very key level to hold and if we hold that I expect ATOM to explode to over 32 dollars in the coming weeks.


ATOM Finally Gaining TractionATOM has been in a range for what seems like forever in crypto. It's pushed above mid range again after making a higher low (on higher time frame), if it can hold mid range after a retest, the arrows would prove to be a solid entry targeting range high and all time high+.
Indicators have been reset fairly well and all significant moving averages and vwap's are below now.

Cosmos setting up for a big move
Internet of blockchains
Catalysts
- Interchain staking (31 Dec '21)
- Staking derivatives
- Smart contract platform
- Gravity bridge ( $ETH Bridge)
230 apps built on
- AKash network
- Anchor protocol
-Ankr
-Binance smart chain
-Bluezelle
- Celer
-Kava
-Matic
-Terra
Market cap: $4.5Bn
No max supply (Forever inflationary)
TA,
Anchored VWAP + Volume profile
Consolidation and holding level
Ascending triangle
Entry: Breakout of $23.2 or bottom of Triangle $19.4

Cosmos Network (ATOMUSD) analysis❇️Cosmos Network (ATOM)
A Decentralized Network Of Interoperable Blockchains(Internet of Blockchains)
Cosmos is a network connecting many independent distributed ledgers (e.g., Ethereum, Bitcoin) to achieve interoperability across blockchains. Its goal is to "create an Internet of Blockchains", i.e., "a network of blockchains where each participant is able to communicate with each other in a decentralized way".
Cosmos is built on a set of independent blockchains referred to as zones, which are powered by the Tendermint Core consensus mechanism - a Byzantine Fault Tolerance (BFT) consensus mechanism used to scale public Proof-of-Stake (PoS) blockchains.
Defined as a "blockchain 3.0"
With these pieces in place, Cosmos is a well-built machine that can easily compete in the modern blockchain market. If the team negotiates a large third-party dApp library and gains enterprise buy-in, this could be a sleeping giant in blockchain.
-----------------------------------------------------------------
❇️Technical analysis
ATOM/USD is part of a strong bullish trend & fluctuating in an upward channel. Traders may consider trading only long positions (at the time of purchase) as long as the price remains well above ema200. The next resistance located at 5.58 USD is the next bullish objective to be reached. A bullish break in this resistance would boost the bullish momentum. The bullish movement could then continue towards the next resistance located at 7 USD then at the end of chanel 11.8 USD . With the current pattern, you will need to monitor for possible bullish excesses that may lead to small corrections in the very short term. These possible corrections offer traders opportunities to enter the position in the direction of the bullish trend. Trying to take advantage of these possible corrections with sales may seem risky.
In the very short term, the general bullish sentiment is confirmed by technical indicators. However, if you want to take a position be cautious & set up your stop-loss because bearish correction could continue for a while until begin a bullish movements.
--------------------------------------------------------------------------------------------------------------------
👉This analysis is my personal opinion and you are responsible for your own trades or invests.
❤️with Best Regards and successful trades.


ATOM - PT $25.50 - Solid Chart Ready to Breakout Any Hour NowW's all around! We may see a short-term retest of the mot recent bottom before continuing higher.


Atom, cosmosThe more the downtrend line is touched by the higher the price, the weakening of the resistance line. A trend support is supporting the price, and the Bolish market. Everything is ready for a desperate defeat.


Is Atom in a long range ? I'm watching atom during many months now.
This one is, for me, a strong and ambitious project ( you can find informations on Cosmostations )
Technically, after the strong bullrun, in february, Atom seems to be in a range, during nearly two months.
Fibonacci is very precise on it and we can see a very nice range between 0.23 (19.01$) and 0.618 (22.14$)
I stay bullish until RSI stays above 50. On top of that, moving average of MACD indicator is about to cross the signal line, wich should give a nice bullish signal.
Let's see the evolution !

ATOM - FINAL RETEST BEFORE MOONINGHi guys,
my strong hodl on ATOM will start to moon soon, 3 retest, strong triangle, bull market, middle altseaons: it's time
Target : 38$
Profit : ~80%


ATOMUSD LONG/ Come on, get on the train for 110%Excellent deal.
Worth the adventure.
ratio 7/1
Profit 110%
Maximum loss of 16%
