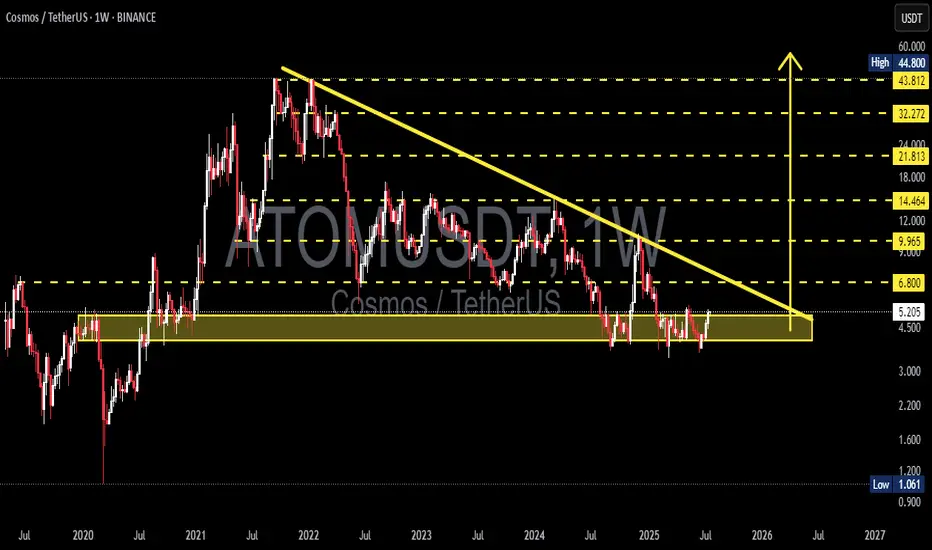
ATOM/USDT – Long-Term Accumulation Phase Nearing Breakout?📊 Full Technical Breakdown:
🟡 Long-Term Accumulation Zone
ATOM is currently trading within a horizontal accumulation zone between $4.50 and $5.20, which has held strong since early 2021. This key area has acted as a solid floor across multiple market cycles, suggesting strong buying interest from
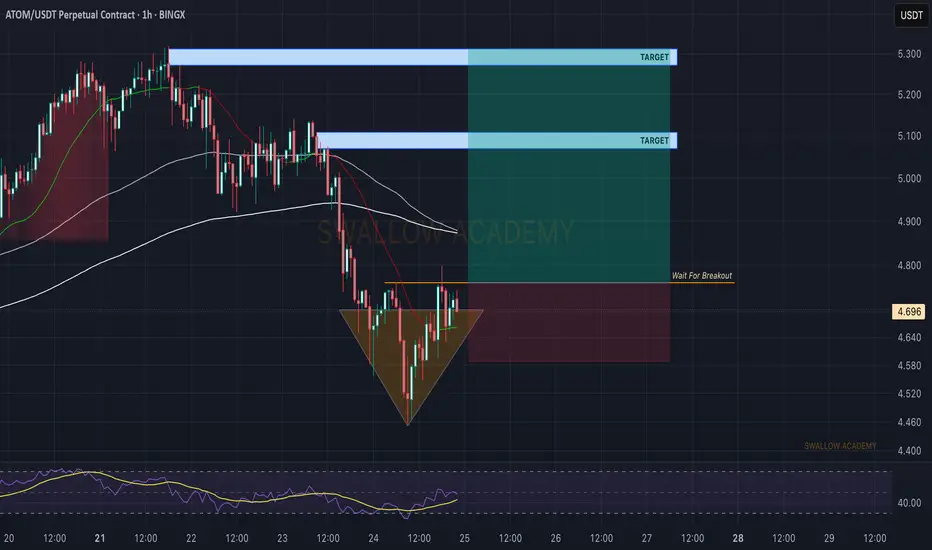
Cosmos (ATOM): Waiting Is Key | Potential Breakout IncomingCosmos might have a good buying opportunity soon, where we are looking for a proper MSB, which would confirm our bullish scenario for this setup here.
As soon as we get the MSB, we are going to look for a buying opportunity.
Swallow Academy
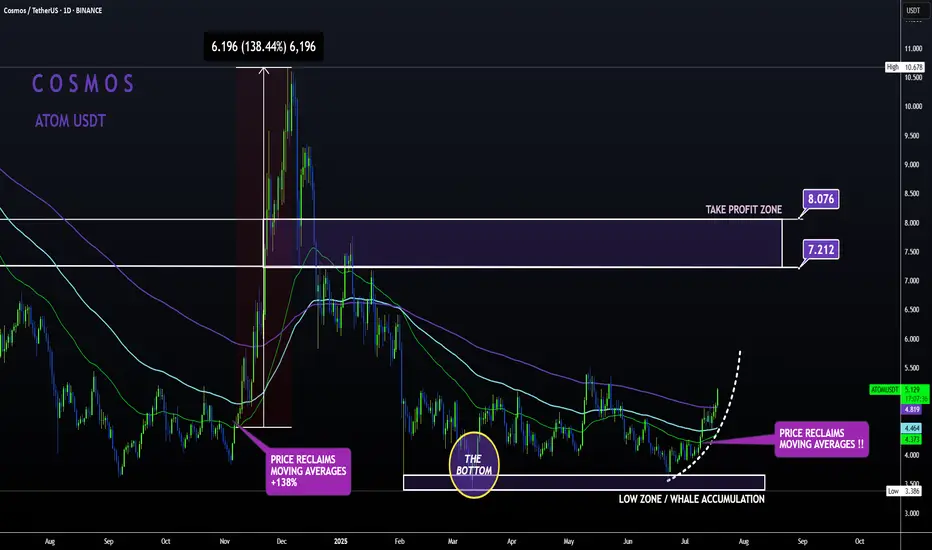
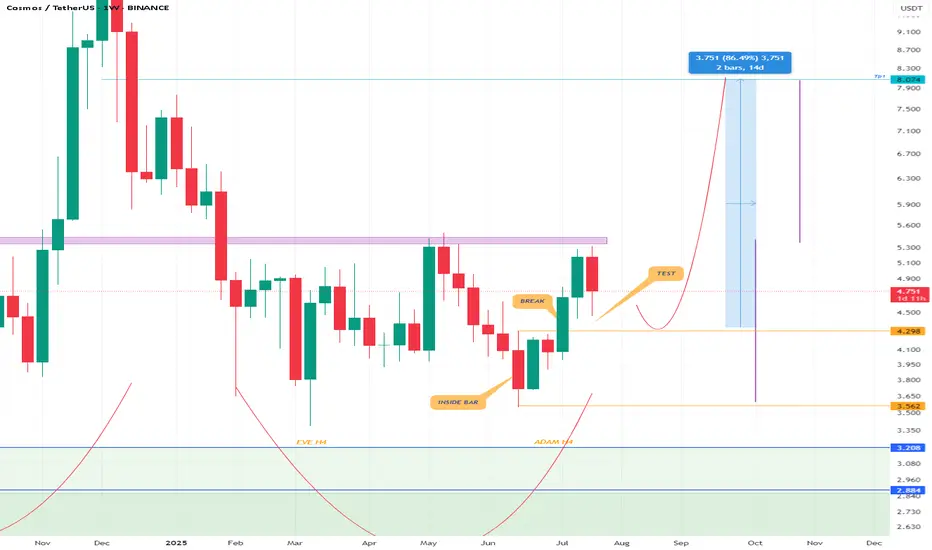
ATOM Sleeping GIANT ALT | Moving Averages BULLISH like NOV24'ATOM is slowly but surely making a turn up towards the first Take Profit point.
From the bottom, Cosmos has already increased a whopping 52% , with even more room to grow:
In my previous update, the 4 was still bearish when looking at trend lines and moving averages.
However, this has flipped
ATOMUSDTHello, the Atom currency has several reversal patterns in its price floor and accumulation. On the daily time frame, we can see an ADAM and EVE. If we look from a more distant perspective, a twin bottom has also formed in the weekly time frame as an extension that seems to be able to grow well. If y

Cosmos (ATOM) Trading At Bottom · Bear Markets End ForeverCosmos is still trading near its market bottom, the "opportunity buy zone" as I call it. This is nothing more than great news.
Remember how I mentioned that some pairs are really advanced, trading already very high and this is risky if you want to go LONG? Well, when projects are trading near the b
ATOMUSDT Channel Breakout Alert!ATOMUSDT Technical analysis update
NASDAQ:ATOM is bouncing from a major support zone and has formed a descending channel at the bottom of the zone on the 4H chart. Currently, the price is breaking above the channel's trend resistance and trading above both the 50 and 100 EMAs on the 4H timeframe

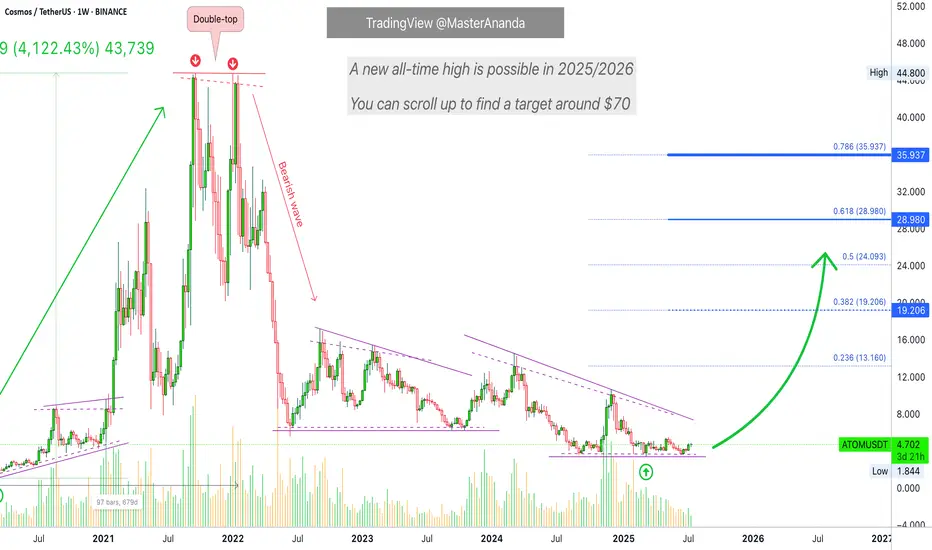
ATOMUSDTAtom has broken out of a good inside bar pattern and is testing it. I think most altcoins have this pattern on the weekly timeframe (you have to check the charts yourself and see what the charts tell you, not what people are emotionally saying on social media). I think the chart can move towards hig
Cosmos (Atom)Atom usdt Daily analysis
Time frame daily
We have 2 models of analysis
1. The green line. Price can't break the resistance line and fall down to 3.5$
2. Price can break the resistance (gray line) and pump to 9$
Therfore we must watch the reaction of price and resistance

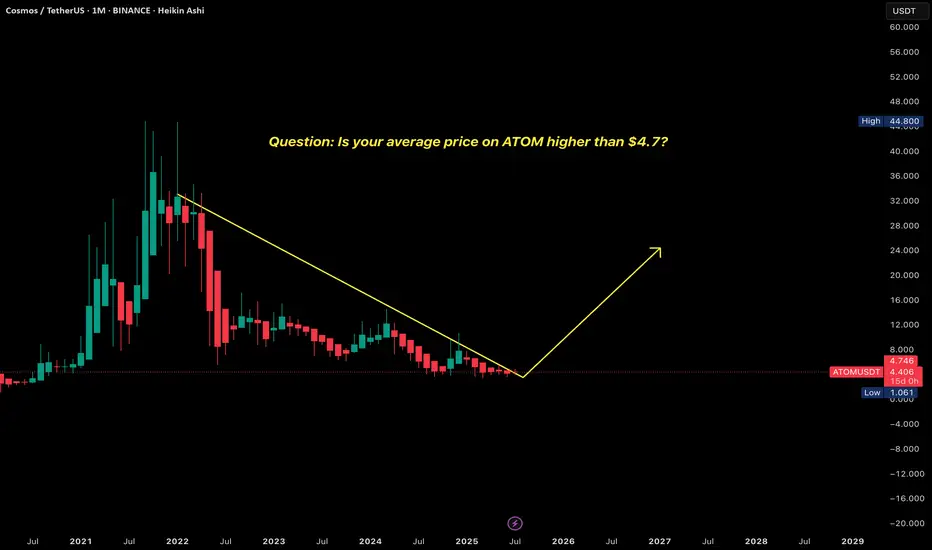
Question: Is your average price on ATOM higher than $4.7?ATOMUSDT – Market Commentary & Buy Strategy
Question: Is your average price on ATOM higher than $4.7?
If you've been buying since post-2022, chances are you're stuck—2023, 2024, and half of 2025 have kept ATOM holders sidelined while the total market cap soared from $1100B to $3700B.
Current
Cosmos (ATOM): Seeing Good Buying Opportunity | BULLISH AFCosmos is pushing strongly, giving us a sign of potential upward movement to happen anytime soon. So let's keep an eye on the 200 EMA and wait for a breakout from there.
More in-depth info is in the video—enjoy!
Swallow Academy

See all ideas
Summarizing what the indicators are suggesting.
Oscillators
Neutral
SellBuy
Strong sellStrong buy
Strong sellSellNeutralBuyStrong buy
Oscillators
Neutral
SellBuy
Strong sellStrong buy
Strong sellSellNeutralBuyStrong buy
Summary
Neutral
SellBuy
Strong sellStrong buy
Strong sellSellNeutralBuyStrong buy
Summary
Neutral
SellBuy
Strong sellStrong buy
Strong sellSellNeutralBuyStrong buy
Summary
Neutral
SellBuy
Strong sellStrong buy
Strong sellSellNeutralBuyStrong buy
Moving Averages
Neutral
SellBuy
Strong sellStrong buy
Strong sellSellNeutralBuyStrong buy
Moving Averages
Neutral
SellBuy
Strong sellStrong buy
Strong sellSellNeutralBuyStrong buy
Displays a symbol's price movements over previous years to identify recurring trends.