ATOM to $30On the above 6 day chart price action has corrected 90% since early 2022. A number of reasons now exist to be long, they include:
1) A trend change in RSI. In fact the first higher low to print since exiting the downtrend in June 2020.
2) Regular bullish divergence as measured over 3 months.
3) Double bottom print on legacy support.
4) The bull flag forecasts price action to the late $30 area perhaps $38.
Is it possible price action continues correcting? Sure.
Is it probable? No.
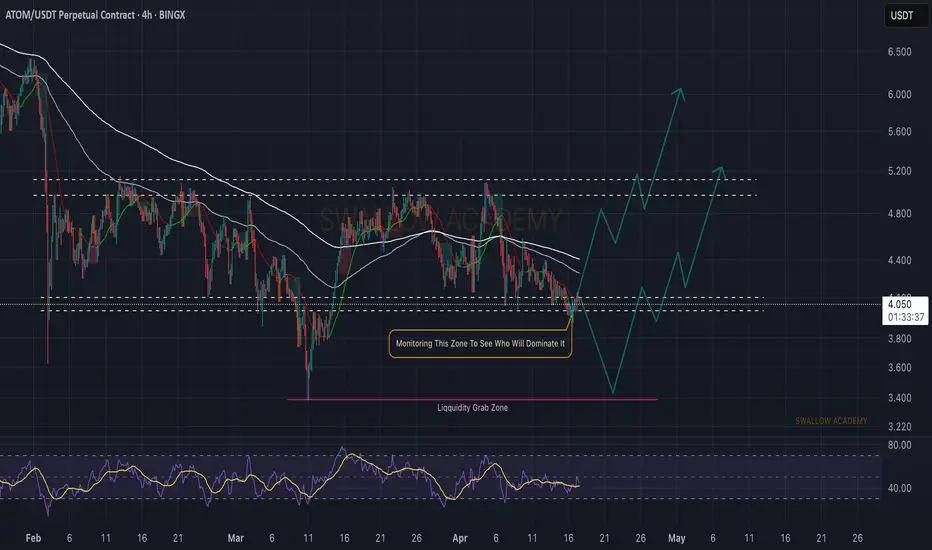
Ww
ATOMUSDT trade ideas

Cosmos (ATOM): Buyers Heading To Fill Bullish FVGsCosmos has recently had a decent movement to lower zones, where, after a proper breakdown (MSB), we are now seeing the second stage for a possible short position, but we are still far away from our entry. We are waiting for more clarity here!
More in-depth info is in the video—enjoy!
Swallow Academy

Trading plan for ATOMA new month has begun, and I’ve marked key monthly levels on the chart—keep these in mind for your trades. Currently, we can clearly see a completed ABC corrective pattern, suggesting a pullback to support this week followed by an upward continuation. I’ve also outlined potential price action in case of extreme selling pressure
Write a comment with your coins & hit the like button and I will make an analysis for you
The author's opinion may differ from yours,
Consider your risks.
Wish you successful trades ! mura

ATOMUSDT Channel Breakout Alert!ATOMUSDT Technical analysis update
NASDAQ:ATOM is bouncing from a major support zone and has formed a descending channel at the bottom of the zone on the 4H chart. Currently, the price is breaking above the channel's trend resistance and trading above both the 50 and 100 EMAs on the 4H timeframe — a bullish signal for ATOM.

ATOM | SLEEPING GIANT | Altcoin GEMATOM is an alt that I have high expectations for.
From a 4h perspective, we can see the short term price is still very bearish.
This is confirmed by trading under the moving averages, which indicates that the sellers are in control.
The great news about this is that the price doesn't stay long UNDER the moving averages in the 4h. From the chart below, we see a very evident bearish trend - the price STAYS under the moving averages, with occasional, random wicks above and to the upper purple (200d MA).
After the bottom, marked the " BIG TURNAROUND ", we see the price trading mostly just under or just above, as we observe range trading. This is how we know, the bottom is in / close. And from here, it's only a matter of time until we start turning around to another bullish cycle . Where the gains far outweigh the risk.
Following this logic, the next reasonable ( very reasonable ) target, is the purple moving averages, and beyond. Currently at $4.3, a nice +8% from here.
_______________________

Cosmos (ATOM): Reached Major Support Area | Good Buying Moment?Cosmos has really good potential for good risk:reward if we see proper MSB to form so that's what we will be waiting for.
More in-depth info is in the video—enjoy!
Swallow Academy

Cosmos (ATOM): Buyers Pressuring Resistance Zones | Price at EMACosmos coin had reached one of the resistance zones where the price has filled major FVG zones. As the price of the coin is expanding, we are looking for possible zones of rejection or correctional zones where we will be looking for market structure breaks.
$4.40, $4.50 and $4.70 are the zones that interest us the most and as we are approaching the $4.40 zone, our attentions are currently right there. Once we see the MSB our target will be around $4.0
Swallow Academy

Cosmos (Atom) 11 Months Within Accumulation ZoneThis is a repeating theme and pattern; this is a classic. Cosmos is now sideways after a correction. The correction is preceded by a bullish wave.
The bullish wave in late 2024 was a short-term, it lasted only one month. But what is interesting is the fact that the bottom range is the same now as it was before the last bullish wave.
If you count the period from the September 2024 low until present day, we have more than 280 days. A very long time. If we start counting from August 2024, when the current accumulation zone was activated, this gives us a total of 314 days, more than 10 months. This is truly all that we need to know. The same low holds for almost a year, getting very close.
If ATOMUSDT does not rise within 2 weeks, this would give us a total of 11 months within the same zone. But it doesn't break, each time a low point is activated there is strong buying and this has been happening long-term.
August 2024, September 2024, November 2024. Then again February 2025, March 2025, April, May and the same accumulation zone is still active today.
The whales are accumulating now, this is their buy-range. Once the accumulation phase is over, we will experience a strong bullish phase. Not a small jump as back in late 2024, but an uptrend, higher highs and higher lows.
Ravencoin weekly is a great example. See the 'related publications.'
Thanks a lot for your continued support.
Namaste.

ATOMUSDT Demand Zone Battle Bullish Rally or Final FlushATOM/USDT is currently consolidating within a long-term descending structure, hovering just above a critical demand confluence between $3.42 and $4.10. This area marks the Immediate Demand Zone, where buyers have historically stepped in, and price action is once again testing its resilience after multiple touches.
A decisive breakout above the $5.47 resistance level, which aligns with the descending trendline from the macro highs, would validate a bullish reversal structure. This could open the path for a multi-leg rally targeting $11.36 in the medium term and $31.09 in the long term, corresponding with historical supply and Fibonacci extension zones.
However, failure to hold the current support zone could accelerate a move toward the deeper Extreme External Demand Zone between $2.15 and $2.590.
The current consolidation carries the potential for both structural reversal and final flush out, and we should closely monitor price behavior around $5.47 for confirmation of directional bias.

ATOM. Massive Liquidity Grab Incoming. 06/12/25BINANCE:ATOMUSDT At the moment, the price is in an accumulation phase.
The buyer interest zone lies between $3.806 – $3.601, which also serves as a strong support area. We may see solid spot/futures entries here and the potential start of a new upward move.
What we’re really waiting for is liquidity to be swept in this zone — where tons of stop-losses have clustered. Such a shakeout would be a perfect setup for a bullish impulse.
Spot/futures accumulation is valid within this zone.
DYOR.

ATOMUSDT 1W Analysis ATOM ~ 1W Analysis
#ATOM Buy back gradually from here if you still have confidence in this coin with a short term target of at least 20%+ from here.

ATOM - Correction almost completeWe're approaching the completion of wave 4. Wave 5 will come down and take out liquidity below.

TradeCityPro | ATOM: Major Support Test in Cosmos Ecosystem Coin👋 Welcome to TradeCity Pro!
In this analysis, I’m going to review the ATOM coin for you. This project is part of the Osmosis network ecosystem.
🔍 ATOM, with a market cap of $1.68 billion, is currently ranked 51st on CoinMarketCap.
📅 Daily Timeframe
As you can see in the daily timeframe, ATOM is currently sitting on a very significant support zone. It has tested this area multiple times, and once again, it’s hovering around that level.
⭐ If the price finds support here and begins to move upward, we can consider entering a long position with a trigger at 4.588. The main bullish trigger will be the 5.380 level, and if that breaks, spot buying can also be considered.
✨ As I always mention with spot triggers on altcoins, it’s best to wait for Bitcoin dominance to start declining before entering. If that happens, ATOM could potentially move toward targets at 7.514 and 10.4.
⚡️ If the key support at 4.075 breaks, we can open a short position targeting 3.501. The 35.68 level on the RSI is a critical support, and a break below it would serve as a momentum confirmation.
📊 Also, keep an eye on market volume. It has been declining recently, and once volume starts flowing in on either side, we can prepare to act on the corresponding trigger.
📝 Final Thoughts
This analysis reflects our opinions and is not financial advice.
Share your thoughts in the comments, and don’t forget to share this analysis with your friends! ❤️

ATOM | Sleeping GIANT Altcoin Gem 1️⃣ATOM is probably one of my favorite altcoins at the moment.
If you look at ATOM from a macro timeframe such as the weekly, it seems like there is barely any hope and that it's just been one big liquidity run.
And although ATOM has retraced nearly 92% since it's ATH, we see a much brighter picture when we look at the daily, or 3D timeframe.
______________________
BINANCE:ATOMUSDT

Atom... Falling wedge Pattern?A chart from my view. Not a prophecy, just a perspective. Risk is yours to carry. As always.
— TheChartMystic

CRYPTO TRADING: ATOM CAN GIVE 50-100% RETURN FROM HEREATOM can give us a good 100% return from here, risking only 18% of the invested amount.
Reason?
Weekly structure has turned bullish.
Daily is super bullish.
My stop loss is below the recent swing low on weekly time frame.

Cosmos (ATOM): Possible Break of Structure FormingCosmos coin is seeing a surge in buy volume where buyers have overtaken the zone at EMAs and now we are 1 step away from a light upward movement, which would fill the bullish CME gap at the upper resistance zone.
As soon as we see a proper break of structure, we will be looking for a buying entry there!
Swallow Academy

Cosmos (ATOM): Sellers Seem to Overtake Support SoonCosmos coin is at a very important support zone, which is one of the strongest support zones from where price has previously started its upward movement.
We can call it a perfect accumulation zone on bigger timeframes but currently, looking at smaller timeframes, we are seeing that after a recent touch to that zone where ideally we should have seen upward movement, we are seeing rather an overtake from sellers where dominance is going into their hands there.
We keep on monitoring for any significant break of structures there to determine in which way we will go but to be honest, we are looking now for that liquidity zone rather than the bullish CME on the upper side.
Swallow Academy
Cosmos (ATOM): Possible Bullish Momentum To Catch | +25% / +50%Cosmos coin is in a sideways channel where if we zoom in we are seeing some signs of a reversed head & shoulder pattern.
Now ideally we would look for the first CME gap to be filled here; once we see a bullish overtake of local resistance there, we will be looking for a fill of the upper CME as well.
Long way to go and for more confirmations, we need to see a proper MSB to form on 30m timeframes near the local support zone so we're watching it closely.
If we see the selling pressure continue below the support, then we will be looking for more dip!
Swallow Academy

ATOMUSDT - LONG-Breaking out of bullish flag + 6 months of consildation range.
-Tested 0.5 +0.618 Fib level well with good volume support.
-Expecting strong move to retest 50 EMA region.

Don't Miss This Big Move on COSMOS (ATOMUSDT)Hello Everyone!
With Bitcoin on the rise and Ethereum likely to follow—as outlined in my recent ETHEREUM analysis idea —we continue to look for strong opportunities in the altcoin market. Right now, all eyes are on COSMOS ( BINANCE:ATOMUSDT ) as it shows promising signs of a potential breakout.
On Weekly timeframe
Price has swept the bottom of September 2024 liquidity zone.
On 4D timeframe
- On the OBV (On-Balance Volume) indicator , price has broken a downtrend—similar to the breakout seen in October 2024 , which was followed by a 170% rally.
- The previous 4-day candle closed above a key Fair Value Gap (FVG), indicating potential bullish momentum.
On 1D timeframe
- V shape inverse pattern.
- There’s significant liquidity in the $6.5–$7.5 range . After successfully breaking above the $5.1 level —just as I strongly anticipated—price is now likely targeting that liquidity zone.
To sum up, BINANCE:ATOMUSDT is demonstrating both fundamental strength and technical confirmation, making it a high-potential candidate in the current market environment.

ATOMUSDT LongThis is not a signal but just my observation since I noticed some double bottom on this time frame 1D.

GANN ATOM Analysis
According to the temporal analysis, the targets highlighted in green are expected to be reached in the coming weeks.
