ATOM/USDT - Will the support hold ? BINANCE:ATOMUSDT (1W CHART) Technical Analysis Update
ATOM is currently trading at $6.786 and the price has reached it's support level and this support level held strong couple of times in the past, i'm expecting the support to hold this time. The trade is invalid if the candle closes below the support zone.
Entry level: $ 6.788
Stop Loss Level: $
TakeProfit 1: $ 8.050
TakeProfit 2: $ 10.629
TakeProfit 3: $ 13.189
TakeProfit 4: $ 17.218
TakeProfit 5: $ 25.846
TakeProfit 6: 38.797
Max Leverage: 3x
Position Size: 1% of capital
Remember to set your stop loss.
Follow our TradingView account for more technical analysis updates. | Like, share, and comment your thoughts.
Cheers
GreenCrypto
ATOMUSDT trade ideas

Cosmos (ATOM): Possible Movement Toward Upper Resistance!We are back with Cosmos Coin, whose price is shwoing so far a good recovery.
We are looking for a touch to happen to the upper zones from where we will be looking for a possible movement to the lower zones so keep an eye on those EMAs there!
Swallow Team

ATOM Technical AnalysisATOM hits the new lows since 2022.The price is moving inside the descending channel from approximately 156 days.
Currently the price is on the support zone (Green) at $4.331 - $4.664 and résistance of descending channel middle line.
There are two scenario's
Bullish Scenario
If the price break above the resistance zone (Blue) at $6.049 - $6.590 and the descending channel upper line with high volume we could the price to the next level at $8.853 and the momentum continues the price may reach to the highest level marked on the chart at $14.186.
Bearish Scenario
If the price fails to hold the support zone (Green) we might see decline in the price to the next support zone (Pink) at $2.988 - $3.309. We might see further decline if the price fails to hold the support zone (Pink)

ATOM/USDT Trading ScenarioAs a result of "Red Monday," the price chart of ATOM hit new lows since 2022. Notice how the price stabilizes in the range of $6.551 to $14.216. This range indicates heightened interest from market participants, confirmed by the volume profile. Amid widespread panic, the asset's price moved outside this range. From a long-term investment perspective, this situation appears promising. The current price may represent an opportune entry point into the asset.

ATOM/USDTthe market was badly hit but few alts starts to rebounce along with NASDAQ:ATOM which's now at decision point, imo from here when price failed to reclaim above trendline is valid short retest, otherwise we i will build a long position when price successfully take over to the top.

Are Altcoins a Safe Investment?Recently, I got into several conversations and realized that many put a lot of faith into altcoins when there's ample evidence that points in the other direction.
Take for example Cosmos or ATOM. One of the most promising ecosystems in the last crypto cycle. Flagship projects include Osmosis or Kujira. Most recently, Kujira imploded as an ecosystem when it was uncovered that the team used users money to leverage liquidity on their apps.
But this post is not about Kujira. It's about Cosmos as an ecosystem. One of my recommendations is to invest in thriving ecosystems (buy the casino, don't play its games). Back in 2021, Cosmos looked like a great bet as an alternative L1 to Ethereum.
However, three years later, ATOM's price is lower today than when Bitcoin bottomed at 15k in 2022! Its bear market never ended, it got WORSE! Just look at the chart.
How many altcoins experienced the same situation lately? It's a long list.
Altcoins like Solana, that did a 25x since its $8 low in 2022, are an exception! And these exceptions rarely repeat for the same altcoin. In light of that, betting on alts is a bet with the odds against you, in most cases.
If you're lucky to buy into an altcoin that does a 10x or more, then consider yourself lucky and secure those profits by buying Bitcoin. Bitcoin has been the ONLY coin to make higher highs for over 15 years. To date, both Ethereum and Solana failed to make a higher high or ATH in this cycle, but Bitcoin did! Perhaps a warning to be extra careful.
I've been in crypto for over 10 years, and every year I am more convinced that Bitcoin is the only good bet long term. If you're here for quick gains, no harm in trying your luck with altcoins, but if you plan to stick around for more than a few years, make Bitcoin your end goal.
Let me know what you think and ping me if you have any questions.
Duo

ATOM longQuite an old project, but it does not lose its relevance. The ecosystem is developing and now the prices are such that anyone can participate with ATOM. I am personally considering this project and would like to receive the final drop to buy this coin at 3.333

Cosmos (ATOM): Sharp Rejection From 200EMA / More To FallWe are back with Cosmos after catching that nice breakdown from the local sharp trend!
As of now, we have had a nice rejection and a breakdown so we are looking for that lower support zone to be reached!
Swallow Team

Long on Atom - Possible double-bottomWell, I wasn't even watching this coin for quite a while now but given its market structure I believe it's worth a shot to risk a long from current prices.
Took out the '22 lows and appears to be printing a nice double-bottom setup on daily timeframe: These setups are by far my favorite since they usually have a low chance of failing, defined risk-reward and obviously a decent ROI.
Target as shown in the chart, not interested in holding this coin longer than that.
Stay safe!

ATOM (Cosmos) Potential Reversal from Long-Term Downtrend#ATOM/USDT #Analysis
Description
---------------------------------------------------------------
+ ATOM is currently trading near $5.05, slightly above the key support level of $4.46. The 21 EMA ($5.67) and 55 EMA ($9.00) are still above the current price, which may act as resistance levels if the price attempts to move higher. A successful break above these EMAs could further confirm the bullish reversal.
+ The chart highlights a strong support zone around $4.46
+ The RSI is currently at 32, indicating that ATOM is in the oversold territory and could be due for a bounce.
+ If ATOM holds above the $4.46 support level and breaks above the 21 EMA, we could see a rally towards the $14.65 resistance level. This would represent a significant potential gain of approximately 200% from the current price, making it a compelling setup for bullish traders.
---------------------------------------------------------------
VectorAlgo Trade Details
------------------------------
Entry Price: 4.464
Stop Loss: 3.128
------------------------------
Target 1: 5.772
Target 2: 7.203
Target 3: 9.581
Target 4: 14.333
------------------------------
Timeframe: 1W
Capital Risk: 1-2% of trading amount
Leverage: 5-10x
---------------------------------------------------------------
Enhance, Trade, Grow
---------------------------------------------------------------
Feel free to share your thoughts and insights.
Don't forget to like and follow us for more trading ideas and discussions.
Best Regards,
VectorAlgo

Cosmos (ATOM): Waiting For Break of ZoneCosmos has made another touch of EMAs, and yet again, we got a nice rejection.
As we see the dominance of sellers in the upper zones, we are now looking for our dotted zone (line) to be broken, which would result in a break of structure and a possible movement to the lower target zone here!
Swallow Team

Atom accumulation zone, monthly levelesone of the largest ecosystems may touch some prices that you simply have to buy

ATOMUSDT Long Entry Opportunity✉️ Pair: ATOMUSDT
📈 Direction: Long
💯 Leverage: Cross 5x - 10x - 20x
📊 Entry1: 6.300 USD
📊 Entry2: 6.000 USD
📊 Entry3: 5.700 USD
✅ Target1: 7.200 USD
✅ Target2: 7.700 USD
✅ Target3: 8.800 USD
⛔️ Stop Loss: 5.500 USD
NASDAQ:ATOM has been trading within a descending channel on a daily timeframe, consistently respecting the trendlines. Recently, the price received a positive push from a successful retest of the channel's lower support. We anticipate a significant breakout, supported by the liquidity at $7.660, which could indicate a strong bullish move and a potential trend reversal.
🔔 For more updates, follow me and don`t forget to hit the BOOST :D

#ATOM/USDT#ATOM
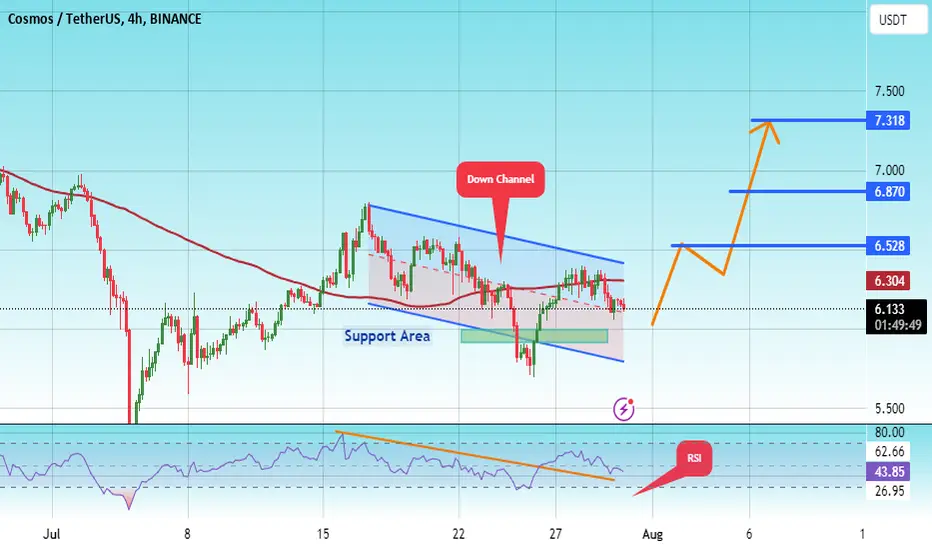
The price is moving within a descending channel pattern on the 4-hour frame and broke it upwards after adhering to it significantly
We have a downtrend on the RSI indicator and it was broken upwards and we have a trend to stabilize above it
We have a major support level in green at a price of 5.90
We have a trend to dot above the moving average 100
Entry price 6.10
First target 6.52
Second target 6.87
Third target 7.32
ATOM Technical Analysis in a 3-Day TimeframeHello everyone, I’m Cryptorphic.
For the past seven years, I’ve been sharing insightful charts and analysis.
Follow me for:
~ Unbiased analyses on trending altcoins.
~ Identifying altcoins with 10x-50x potential.
~ Futures trade setups.
~ Daily updates on Bitcoin and Ethereum.
~ High time frame (HTF) market bottom and top calls.
~ Short-term market movements.
~ Charts supported by critical fundamentals.
Now, let’s dive into this chart analysis:
ATOM is currently holding a crucial support trendline at $5.727. It is important to see if ATOM can hold strong and reach higher levels, or if it will break down further.
The 21 EMA serves as the primary resistance for ATOM, and a close above it will likely allow the price to rally higher.
Key levels:
- Important Support/Entry: $5.727 to CMP
- Primary Resistance: $6.855
- Target: $13.62
- Invalidation Point: a close below the support trendline.
DYOR, NFA.
Please hit the like button to support my content and share your thoughts in the comment section. Feel free to request any chart analysis you’d like to see!
Thank you!
#PEACE

Wait for best positionATOMUSDT Analysis 📊
Key Levels:
Resistance Level: $7.116 🔴
Support Level: $5.051 🟢
Entry Level: Around $6.270 to $6.318 🚀
Take Profit Points (TP):
TP-1: $6.550 🥇
TP-2: $6.851 🥈
TP-3: $7.082 🥉
Trend Analysis:
Bullish Movement (Pump):
The chart indicates the best entry point after breaking the resistance at $6.318 🚀.
In this case, there is a strong probability of a bullish move that could push the price to the specified targets 📈.
Entry and Exit Points:
Entry: When the confirmed candle is around $6. 📥
Exit: At target levels $6.550, $6.851, and $7.082 depending on risk tolerance and profit goals 📤.
Risk Management:
Stop Loss: Around $5.744 to $5.713 ❌.
Profit Target: Up to 17% 📈.
Recommendations:
Profit Expectation: If you aim for a 17% profit, wait for the price to reach $7.116 🤑.
Entry Condition: It’s best to enter after confirming the resistance break and closing the candle above $6.318 ✅.
Position Management: Always consider your risk-to-reward ratio and stick to confirmed signals 🔍.
This analysis is based on the provided information and chart. Always conduct your analysis and review your strategies 📚. Also, never forget risk management 🛡️.

ATOM: Understanding the Key Levels and Trends✨ Welcome to my channel. Here, we analyze a new crypto project or Forex pair every day.
📅 Let's dive into today's analysis, focusing on the ATOM coin in the crypto market.
🗂 About the Project: ATOM, or Cosmos, is a decentralized network aiming to facilitate interoperability between multiple blockchains. It is known for its unique consensus mechanism and ability to enable communication between different blockchain networks. Cosmos is particularly popular among DeFi and blockchain developers due to its scalability and modular architecture.
📅Weekly Timeframe
In this timeframe, ATOM has experienced significant movements. Recently, it saw an upward trend reaching a peak around the $44 level, which was a critical supply zone. Following this, the price entered a correction phase with lower volume, suggesting the strength of the previous upward trend. Currently, ATOM is at a support level of $6.51 after a correction phase.
📈 If ATOM stabilizes above $8.08, we can anticipate a bullish momentum potentially pushing the price towards the next resistance at $16.07. Confirmation of a new upward trend will depend on candle stability above this level.
📉 Conversely, if ATOM falls back into the range between $6.51 and $8.08, and stabilizes below $6.51, it indicates a bearish trend continuation. The next critical support level would be around $4.50.
📊 In both scenarios, volume analysis is crucial. A healthy trend should be supported by corresponding volume without any divergence.
📅Daily Timeframe
🔍 On the daily chart, ATOM ranged around the $8.07 level before initiating another downward wave. Currently, there is noticeable bearish momentum, and the price has found temporary support at $6.00.
🧲 Given the current setup, a stabilization below $6.00 could signal another bearish wave. On the flip side, if the price moves above $8.07, it could indicate the start of a bullish trend, targeting higher resistance levels.
📅4-Hour Timeframe
📈 In the 4-hour timeframe, ATOM has pulled back to the resistance at $6.56. Volume analysis shows a decrease, indicating potential exhaustion of the recent upward movement.
📉 For short positions, the key levels to watch are $6.56 and $7.03, where price reactions could provide better entry points. For long positions, critical levels are $5.77 and $5.20.
💥RSI Oscillator
The RSI is currently ranging between 31.20 and 36.56 on different timeframes. Breaking these levels could provide confirmation for opening positions. However, always use these levels in conjunction with candle patterns and volume analysis to find the best entry and exit points.
📉 Given the current bearish signals in the daily and 4-hour timeframes, alongside the potential trend change in the weekly timeframe, I am inclined to open a short position. However, this is based on my trading strategy. Each trader should base their decisions on their strategies and risk management plans.
⚠️ Please note that this is not financial advice. I'm simply introducing this project to you, and remember always to do your own research.
🫶 If you found this analysis helpful and want to support me, please boost this analysis. Feel free to leave a comment or suggest a coin you'd like me to analyze next.

Cosmos (ATOM): Possible Zone of Rejection!Cosmos is looking nice after the rejection from resistance and 200EMA.
We are now looking for further movement to lower zones here so eyes open. There is a good chance that if we break that trend there, we will see a sharp drop from there!
Swallow Team

ATOM 1DATOM in pair with USDT on a one-day time frame is moving in the local downtrend channel, which is in a strong downtrend channel. You can see the upward break from the downward trend line and the current movement close to the downward trend line itself.

ATOMUSD waiting for a buy signalWe already got the buy signal emerging. Just waiting for this ABC correction to complete.

Buy ATOM
ATOM is testing again it's range low.
I bought ATOM at the current price. Invalidation and final target are mentionned in chart.
Disclaimer:
This analysis is based on my personnal views and is not a financial advice. Risk is under your control.


Cosmos (ATOM): Re-Testing The Broken Neckline Zone. Cosmos is re-testing the broken neckline zone, where price is showing similarities with recent re-test we had on June 27th.
We are waiting for a successful rejection from here, which would push price back to lower zones here
Swallow Team
