ATOMUSDTThe price has corrected to the Fibonacci retracement levels of 0.705-0.786 and currently at the point of control, where the most volume has been traded. This indicates that the asset is experiencing significant interest from traders and investors.
The ascending structure with three completed higher lows on the three-day chart implies a bullish signal, which may suggest a potential upward trend.
According to your indicator, the asset's momentum has almost reset. You believe that the price might need to experience some sideways movement before breaking out of the current range in the direction of the mentioned targets.
The first price target is $25 area, and the second price target is $35 area. These targets may provide potential profit-taking opportunities for traders and investors.
ATOMUSDT trade ideas

ATOM/USDT what do we see here? Hey guys 👋
ATOM coin has had a nice bounce from that lower support zone where currently it is going for those upper zone to claim them. We are going to wait for that upper zone to be secured by bulls before we enter the position but overall view should be seen here.
If you like ideas provided by our team you can show us your support by liking and commenting.
Yours Sincerely,
Swallow Team 🔱
Disclamer:
We are not financial advisors. The content that we share on this website are for educational purposes and are our own personal opinions.

ATOM HIGH RISKWe tested major breaker and lost minor breaker, liq grabbed and pair wants to go with volatility so shorting is not much problem I think. If this stops I will be in longs when pair test red box
good luck

Atomusdt: Short this pumpHello Traders!
Welcome back to another trade with analyst Aadil1000x.
Today we are going to sell the atom as it has formed a 'J' pattern above the trendline which is a sign of a bearish move.
Atom Short now @ 11.39
Stoploss 11.647(-2.12%)
Target 1, 11.107(+2.6%)
Final Target 10.781(+5.47%)
Don't forget to hit the like button and follow to stay connected.

COMSOM USDT FThe information and publications are not meant to be and do not constitute financial, investment, trading, or other types of advice or recommendations supplied or endorsed by TradingView. Read more in the Terms of Use.

ATOMUSDT Elliott Waves AnalysisHello friends.
Please support my work by clicking the LIKE button👍(If you liked). Also i will appreciate for ur activity. Thank you!
Everything on the chart. (update)
Nothing has changed since my last idea, everything is relevant, still waiting for +-20$ zone.
Entry: market and lower
Targets: 16 - 18 - 20 and maybe ~22(not sure)
after first target reached move ur stop to breakeven
Stop: agressive 10.2, conservative 8.8 (depending of ur risk). ALWAYS follow ur RM .
RR: 1 to 4.5
risk is justified
Good luck everyone!
Follow me on TRADINGView, if you don't want to miss my next analysis or signals.
It's not financial advice.
Dont Forget, always make your own research before to trade my ideas!
Open to any questions and suggestions

ATOMUSD ❕ fixed in the channelATOM moves over liquidity.
Trading volumes are up.
The RSI chart on the 4H Timeframe indicates a shift of initiative to buyers.
I believe that the asset will continue to rise after the retest of the lower boundary of the channel.

Home Work #2 Part 2 ATOMThis is home work on ATOM as of 2022 - 2023. The goal is draw the channels with support and resistnace trend lines.

Cosmos possible adam and evePossible double bottom on trendline with an Adam and Eve formation.
Will take sometime to develop if correct.

$ATOM Risky long but long. The scenario is good for a pump in atom yet dangerous as BTC is on the verge of a crash.
But let's keep the SL and be patient.

Atom Long Fractal in play i think, expecting the price to be pushed up filling both the weekly imbalances, also confluent with a golden pocket btw swings.
Lvl holding pretty well so far, bb squeeze trigger, EMA ribbons trigger long small tf..
NFA

Cosmos shortCosmos bounced off the descending trendline. Asset bounced off the resistance level. Bearish movement to support level at 10.61 is possible.

🔥ATOM CLOSE TO HUGE VALUE AREA: $20 IS STILL POSSIBLE🔥Hi, friends! dYdX migrates from Ethereum to Cosmos (ATOM) blockchain.
USDC's co-issuer, Circle, has also announced the launch of a stablecoin on the Cosmos network.
This fundamental news can trigger ATOM growth up to $20. We should pay attention to the chart and find the best entry point before 90% growth.
📊 TRADING PLAN FOR ATOM:
🔥 test the $9.5-10.5 value area as the support
🔥 volume growth
🔥 squeeze to the trendline
🔥 bullish BTC is a must-have for altcoins growth
✅ MY LONG TARGETS FOR ATOM:
1. $13.5 - the key level
2. $15.5 - the key level and local high
3. $20 - the even number and key level
💻Friends, press the "boost"🚀 button, write comments and share with your friends - it will be the best THANK YOU.
P.S. Personally, I open an entry if the price shows it according to my strategy.
Always do your analysis before making a trade.

$ATOM - Short Trade Set-Up$ATOM - Short Trade Set-Up
Entry Conditions:
| Rejection from bearish trednline
| Failed to break the 200 EMA Daily
| Big Bearish Divergence
| About to break RSI Support

🔥✅THE BEST TRADING PLAN FOR ATOM: $10 IS A CLOSEST TARGET🔥 Hi friends! Today I'll show you the most possible trading plan for ATOM.
We see how the price bounced from the $9.8-10.3 value area. I think it will happen one more time because this value area is strong resistance to the price.
✅ Now we should wait for some pullback to enter a long with a target at $10 as it is shown on the chart.
The price can go even higher if it breaks the value area and tests it as support! But when the price reaches this value area, I recommend you keep your attention on the chart. A false breakout is a very common thing after such growth.
🚩 If we compare the previous example to this situation, we will see that after the first test of the value area the price fell by -15%. The same can happen this time.
✅ The short target is an $8.5 key level and even lower to $8.
🔥 Stay tuned to get more updates and ask questions in the comments to get help in trading!
💻Friends, press the "boost"🚀 button, write comments and share with your friends - it will be the best THANK YOU.
P.S. Personally, I open an entry if the price shows it according to my strategy.
Always do your analysis before making a trade.

ATOMUSDT LAST HOPEAtom has been the worst performer among cryptocurrencies so far. The last place to throw Atom up or down is approaching. I am an optimist and want to open a long position. This is not a financial advice and only my personal opinion.


ATOMUSD ❕ oversoldATOM is oversold by several indicators.
The chart has reached the lower boundary of the channel.
I think the asset will bounce from the border.

Cosmos coin is in an optimal buying zoneThe price of Cosmos coin is currently in the optimal buying zone, ranging between $11.41 and $10.31, with a local selling target of $19.54. This asset is in an uptrend, which is a favorable factor for further price growth. In case the price falls below the upward trend, a stop loss is set to protect the position at $8.43. The setup is expected to be realized in April. Additionally, there are plans to double the position after overcoming the downtrend.

ATOM bearishATOM follow down channel
It was rejected from EMA20,50 and 200
Two support are is possible
A and B
Becase A was knocked 2 times, it could not be strong enough

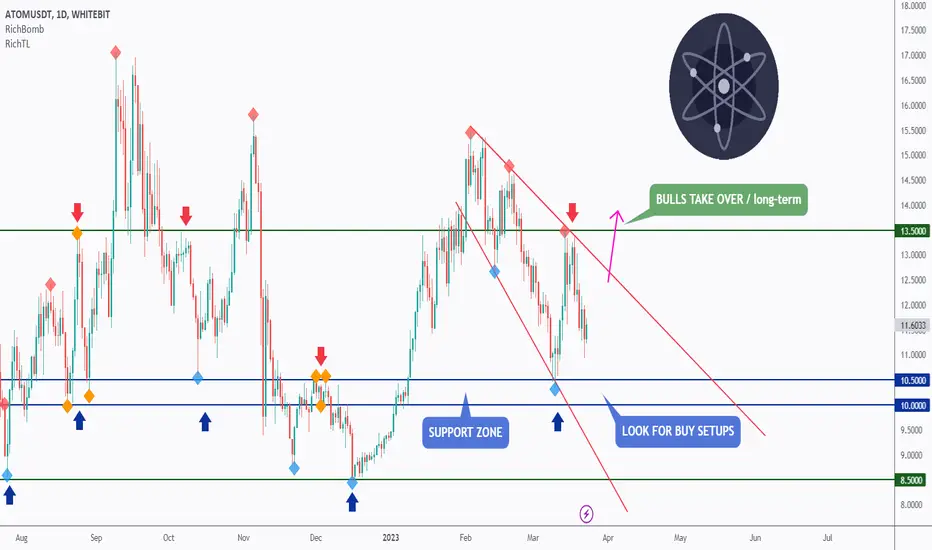
ATOM - Once a Beast; Always a Beast 🦾Hello TradingView Family / Fellow Traders. This is Richard, also known as theSignalyst.
ATOM has been overall bearish trading inside the falling broadening wedge pattern in red.
🏹 For the bulls to take over long-term , we need a daily candle close above 13.5 resistance.
Meanwhile, If we retest the blue support around 10.0, we will be looking for buy setups on lower timeframes.
📚 Always follow your trading plan regarding entry, risk management, and trade management.
Good luck!
All Strategies Are Good; If Managed Properly!
~Rich

Cosmos (ATOM) formed bullish Gartley for upto 13% pumpHi dear friends, hope you are well and welcome to the new update on Cosmos (ATOM) coin.
Previously I shared a long-term trade setup for ATOM, which is still in play as below:
On a 4-hr time frame, ATOM has formed a bullish Gartley move for another price reversal.
Note: Above idea is for educational purpose only. It is advised to diversify and strictly follow the stop loss, and don't get stuck with trade
