ATOM/USD Inverse head and shoulders patternPossible inverse head and shoulders in the making for atom/usd. We may have a little bit of downside if BTC has a wick down however, patience will be rewarding. Altcoin market dominance on a longer trend looks bullish for now. Need a push down in BTC dominance for the alts to rally. Lets see what the next few weeks and months brings. Stay positive and level headed. (not financial advice).
ATOUSD trade ideas

Still long on ATOMAn update on COINBASE:ATOMUSD - I'm still bullish (whatever that means), I would worry if we get deep below 30 USD. I think price discovery will start in the next weeks.
Everything is crabbing right now because the money printer stopped and we're switching to a zero sum game. It won't last IMHO as I expect institutional money to move in later this year. ATOM temporarily escaped the macro trend because it has extremely positive news on its own.
Stay lo iq. DYOR.

Cosmos shortCosmos broke trough the ascending trendline. Asset broke trough the support level. Decline to support level at 33 is expected to happen.
ATOM - Flat top Consolidation?I recall reading that throat top consolidation patterns have an increased likely hood to break out in the direction of the flat. . .. . Like its building up pressure under the resistance until it pops! I’m talking about the yellow triangle on this chart.
If that is true, the blue trace is scaled from a previous time when the price pressed up into a resistance level with a flat top wedge shape.
Per Eliot wave theory, we normally see a low level, mid level, and top level in any motive wave. In between each level, there should be a little pull back (at a level on a smaller time frame) between each of the bottom mid and top main levels. That observation also guides and correlates with this blue projection.
We can also see that we have entered into a harmonic pattern that has departed bullishly from the orange pattern that had been influencing us.
Depending on the success of this bullish effort, we will wait her continue our bullish departure, or have a larger gap to make up on the next bearish movement, since the support levels that the orange trace is dancing along are still significant for use… and quite a bit lower now. We have observed many times where an additional leap transforms into a continued bearish move similar to the forecast, as it crests over. Like the drummer played an extra enthusiastic note on this level.
If you are interested in following along as these moves play out… follow me… and ill post updates to this post throughout the week :)
Good Luck, God Speed, Love & Light!

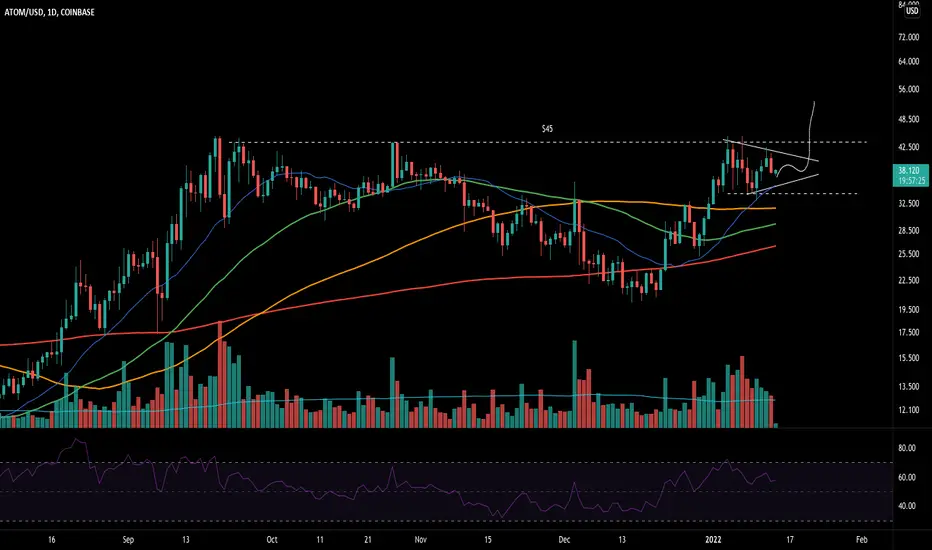
Update: ATOM now at a very crucial pointATOM was rejected at 45 for the 6th time. Take some pofits if you bought at low of channel
so you can still buy at breakout of 45.
Be careful. watch Atom if it can still hold 40 & 37.
If not, it may be doing a Gartley pattern down to
30, the low of the big trading channel of 30 to 45.

ATOM arc bottom
ATOM arc bottom
it has been adjusted
It's about to start a new round of gains
Follow me to take you to achieve financial freedom

Another Rejection from Resistance or New ATHs Ahead??It's a tempting short position due to the risk to reward ratio. But Atom has tested this high three times already, will it fail a fourth?

$ATOM to enter price discoverygm
There's not much to say, the CRYPTOCAP:ATOM ecosystem is going to be the center of attention in the next months and we're about to enter price discovery. If you haven't entered earlier, now isn't too late. This is a very solid project with great fundamentals.
If the overall crypto market continues to be bullish $200+ is absolutely within range. We did 4X in less than 6 months and the trend seems to accelerate.
Keep it lo iq. Only invest what you can afford to lose.

ATOM DI'm long. Publish for the lulz as we hit measured move targets at 55 to see a reaction.
Thanks to the sniper for reinforcing buy zones rather than the degen fomo lyfestyle!

ATOM Short IdeaI am looking for a short for ATOM because it is now oversold on RSI at 1 hr, it is in the daily order block that has seen multiple rejections, the lower time frame entry from a 5min perpetual down candle that I am looking at. The invalidation is candle settles of 5 min above 42.38.

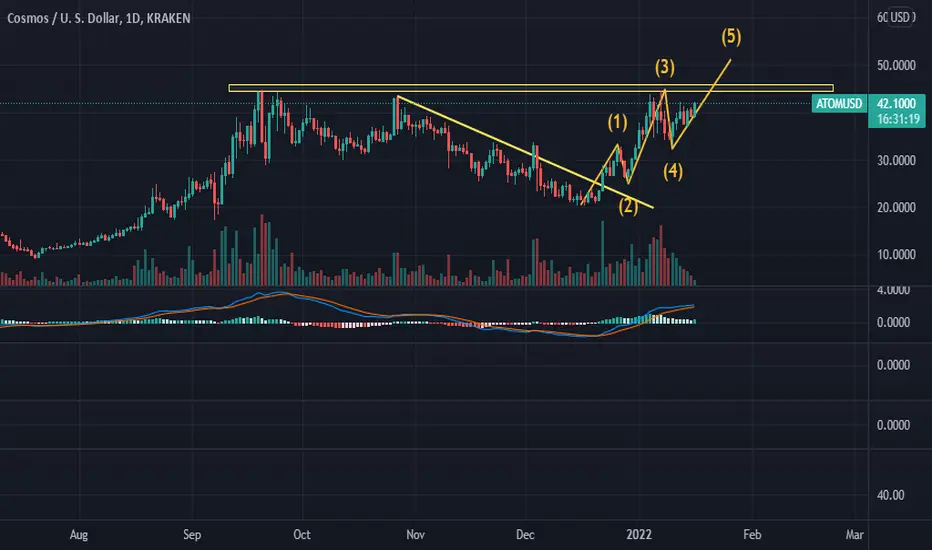
ATOM, there is a high probability of a new high.The following content is machine translation:
A pullback was blocked near the previous high.
Support lows keep rising.
From the point of view of this rising wave, it can be seen as 5 waves.
It is currently in a 5-wave uptrend.
Wave 5 will surpass wave 3 to break new highs.
The indicator macd rejects the Sicha trend.
Waiting for new highs.

ATOM on the move and bullflaggin'Atom has come up off support and gained interest from the buyers, BTC seems to be holding. I have identified a bull flag in the works if we can just hold momentum for continuation. We are about to flip the hull suite as well, seems bullish to me. NFA, DYOR

ATOM (Cosmos) making a flag after 2 buy signalsWe now have Faang crypto version.....the FOAN (Ftm One Atom Near).
Two previous buy signals generated by Stoch Rsi cross, CCi & ema5...waiting for 3rd.
Now seems to be making a flag pole with a measured Target.
Not financial advice.

ATOM Basing under ATHATOM looks like its building out the right side of its base just underneath the ATH. This has been one of the 2021 laggard L1s that I think will play catchup do very well this year. Would like to see a bit more consolidation on declining volume as selling pressure dries up and gets absorbed.
Currently, $9bn market cap w/100% supply circulating
Market cap of some comps:
SOL - $47bn, 5x higher
LUNA - $30bn, 3x higher
DOT - $25bn, 2.5x higher
AVAX - $22bn, 2.25x higher
Pivot Yearly predictions for Atom using hidden pivotsThis is a very basic but powerful trading idea published as part of my Crypto market analysis for 2022.
It demonstrates the earning potential, predicted by Traditional Yearly Pivots.
On top of that, it uses my Hidden Pivots Indicator that is plotting additional levels of pivots from the R6-R10 and Support Pivots (If calculation allows it, as in many cases it won't) from S6-S10.
The Indicator plots automatically on each time frame.
You can have a look at it here:
And a deeper explanation of it here:
medium.com
In the case of $ATOMUSD, you can see the four scenarios on the chart:
1.Likely in case of bear year - Downside to the S1.
2. Likely in case of bull year - Upside to the R1.
3. Likely on as very bullish cycle - Upside to the R5.
4. Likely on a bananas rocket to the moon year - Upside R10 and beyond.
For the whole long read and analysis on the pivot side of the crypto market 2022, see here:
rotzeod.medium.com

Atom - Pull back to the .618?Good Morning,
ATOM just tested its recent peak and came up just short... good news, that lower high is likely a continuation pattern... we just need to recharge the RSI before we can leap onto the next level!
Here is how that might look, based on a recent similar movement.
If you find this post interesting, follow me, and ill post updates to it periodically.
If you find my homework confusing... definitely follow me... it will start to make sense the more you see it.
Good Luck, God Speed, love and Light!

Atom channel tradingOf all the altcoins Atom is currently the only one that doesnt trade at the bottom of its channel. I would enter a short AFTER it forms the double top on the daily and confirms it with a daily red candle close bellow the sky blue line. BUT dont take this line too seriously its just a line it might get retested so entry on retest is the safest option. For risk takers just go for it when it closes bellow sky blue on the daily and hold this short open for a few weeks its a swing trade so just chill. Stop loss should be the top of the last daily candle. I know its a large loss if it triggers.. but the risk reward is in a good ratio.

ATOM moving higher !ATOM looks to be moving up even higher, it seems like if we can sustain momentum we should be able to hit $42-43 easily. NFA, DYOR

ATOM 4 hr Elliot wave analysis Trade breakdown:
1. Buy @ $39 with stop loss below $35
2. PT around $49
Good luck!


COSMOS setting up for a new high with AOTSI don't know what fundamental news about ATOM but it is setting up for a new rally.
anybody who knows pls comment.
Long correction near its end & It has to break 38.33 resistance soon.
recent AOTS (Alingment of the stars, moving averages correctly sequenced)
makes upcoming rally a big probability.

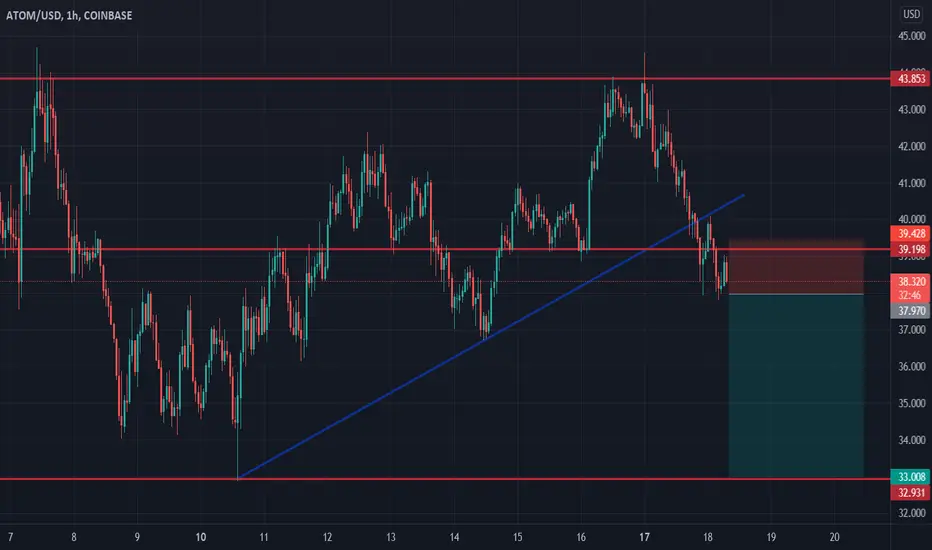
ATOM Short - Entered at 37.7ATOM is a solid project and has risen quite a lot lately, opposite to BTC. Whilst normally I would attribute it to being a solid move, I believe this is simply money moving from BTC into ATOM and not a true breakout pump.
If ATOM continues it's down trend and fails to break out, this could prove a quality short opportunity.
