#AUCTION look good for Long#AUCTION look goods for long
Entry 16
Tp1 18.128
Tp2 19.151
Tp3 21.708
Tp4 24.266
Tp5 25.289
Final Tp 50 to the moon
Sl 14
AUCTIONUSDT trade ideas


AUCTION On the Verge of BreakoutAUCTION On the Verge of Breakout
FWB:69M MarketCap. Hidden gem The second round can start at any time

AUCTION ANALYSIS (breakout)🔮 #AUCTION Analysis - Breakout 🚀🚀
💲💲 In daily time-frame,Falling Wedge Pattern is forming and trying to breakout the pattern ✅
Right now we could see a breakout and retest in #AUCTION. After that we would expect a bullish movement in #AUCTION🚀
💸Current Price -- $17.27
📈Target Price -- $35.20
⁉️ What to do?
- We have marked crucial levels in the chart . We can trade according to the chart and make some profits. 🚀💸
#AUCTION #Cryptocurrency #Breakout #DYOR

Auction Getting Ready For 200% Bullish Wave Auction Looks Attractive Here Foe Midterm After Strong Bullish Wave Auction Almost Completed Its Healthy Correction And Now On Verge Of Falling Wedge Breakout While Rsi Printed Massive Bullish divergence Expecting Successful Breakout Soon Incase Of Successful Breakout Expecting 200% Bullish Wave

AUCTIONUSDT 3DAUCTION ~ 3D
#AUCTION This is a bullish pattern, it is only a matter of time until this resistance line is broken.

AUCTIONUSDT.1DThis technical analysis of the AUCTION/USDT chart captures the recent market behaviors and provides an insight into what might be expected in the near future.
Key Observations:
Current Price and Movement:
AUCTION is currently trading at $17.02, having faced a sharp decline of 14.17% on the day, which indicates significant volatility.
Support and Resistance Levels:
R1 (Resistance Level 1): $22.21 - This is the immediate resistance level the price might face upon any rebound.
S1 (Support Level 1): $12.36 - This support level is crucial as it represents the nearest floor that could potentially halt further declines.
Technical Indicators:
MACD (Moving Average Convergence Divergence): The MACD line is below the signal line but close to converging, suggesting a potential shift in momentum from bearish to less bearish or even bullish.
RSI (Relative Strength Index): The RSI is at 52.83, indicating a somewhat neutral stance but leaning towards neither overbought nor oversold conditions.
Analysis and Conclusion:
The recent sharp drop in AUCTION's price to $17.02 has likely been influenced by broader market dynamics or specific events related to the asset. The proximity to the S1 support level at $12.36 suggests that the market could be testing this threshold soon, especially if bearish sentiment continues.
Given the current setup, if the market finds stability around S1, there could be a potential for a price recovery towards R1 at $22.21. The near convergence of the MACD lines also hints at a possible easing of the bearish pressure. Traders should watch for any bullish crossover in the MACD as a confirmation of changing momentum.
In summary, the market for AUCTION/USDT appears to be at a critical juncture, with key levels to watch at $12.36 for support and $22.21 for resistance. Investors should monitor these levels closely, along with any macroeconomic factors or news specific to AUCTION that could influence market sentiment. This analysis should serve as a basis for making informed trading decisions while incorporating real-time data and risk management strategies.

AUCTIONUSDT(AUCTION) Daily tf Range Updated till 16-06-24AUCTIONUSDT(AUCTION) Daily timeframe range. its in same range levels as i updated it last time. now trying to defend 19.58. if it fails their it will head back to 13.59. if it can stay above 19.58 than it will retrace back to 27.03.

AUCTION ANALYSIS🔮 #AUCTION Analysis 🚀🚀
In daily timeframe, falling wedge pattern is forming ✅
Right now, #AUCTION is trading around it's crucial level 🚀 🚀 if #AUCTION breaks this level then we will be target for 50% in few weeks 💸 💯🚀
💸Current Price -- $21.45
📈Target Price -- $35.40
⁉️ What to do?
- We have marked crucial levels in the chart . We can trade according to the chart and make some profits. 🚀💸
#AUCTION #Cryptocurrency #DYOR

AUCTION Swing LongI am already in a spot position average buy around 17.5.
But from here LL longing dca below 21 with tight stoploss if clean breaks below 20.
I think if this holds here we are going to see a massive rally on this one.
The RR from here is way too much and i am ready to take a risk on it.
Targeting 70 not less not much.
Let's Go.
Note: Not a Financial Advise.

Auction to $16Since publishing the long idea in late August at $4.29 (orange circle) price action has zoomed up 1000%. Not bad. A number of reasons now exist to be short. They include:
1) Price action has arrived at significant support and resistance, $41.
2) RSI is @ 95 on the 5-day, 97 on the weekly chart. The highest in the history of this chart.
3) Price action is four sigmas from the Bollinger Band mean. Four! (see 5-day chart below). How significant is this? If you’re a probability nerd like myself, you’ll know. If you should take away anything from this it is, Price action will ALWAYS interact with the Mean 90% of the time (the orange middle line). Right now that price is $11.
4) Some other reasons said elsewhere.
Is it possible price action keeps going up? Sure.
Is it probable? No.
Ww
Type: trade
Risk: 2-3%
Timeframe for short: Couldn’t say
5-day Bollinger Band

Bounce Token (AUCTION) completed a setup for upto 15.50% pumpHi dear friends, hope you are well and welcome to the new update on Bounce Token (AUCTION) with US Dollar pair.
Previously we caught almost 25% pump of AUCTION as below:
Now on a 4-hr time frame, AUCTION has formed a bullish Butterfly move for the next pump.
Note: Above idea is for educational purpose only. It is advised to diversify and strictly follow the stop loss, and don't get stuck with trade.

#AUCTION Illuminating the Path: Get In on the Buy Action Today!**Technical Analysis Chart Description:**
Welcome to my Technical Analysis charts on TradingView! Before we dive into the analysis, it's essential to understand some important warnings:
1. **Subjectivity Alert:** Technical analysis involves interpreting market data and chart patterns, which can be subjective. Different analysts may interpret the same data differently, leading to varied conclusions.
2. **Historical Performance Doesn't Guarantee Future Results:** Past price movements do not guarantee future price movements. While historical data can provide insights, it's crucial to consider other factors that could influence price action.
3. **Risk of False Signals:** Technical indicators and chart patterns can produce false signals, leading to potential losses if relied upon blindly. Always cross-verify signals with other indicators or fundamental analysis.
4. **Market Volatility:** Crypto markets are highly volatile and can experience rapid price fluctuations. Be prepared for sudden and unexpected price movements, which may invalidate previously identified patterns.
5. **Risk Management:** Proper risk management is essential. Never invest more than you can afford to lose, and consider using stop-loss orders to mitigate potential losses.
6. **Emotional Bias:** Avoid emotional decision-making based on short-term price movements. Stick to your trading plan and strategy, and don't let fear or greed influence your decisions.
**Disclaimer for Crypto Trading:**
Trading cryptocurrencies carries inherent risks, and it's important to understand the following:
Cryptocurrency markets are highly speculative and can be subject to extreme volatility. Prices can fluctuate significantly within short periods, leading to substantial gains or losses.
Investing in cryptocurrencies involves the risk of total loss of capital. Unlike traditional assets, cryptocurrencies are not backed by any tangible assets or central authority, making them inherently risky.
Regulatory uncertainty and market manipulation are additional risks associated with cryptocurrency trading. Regulatory changes or negative news can have a significant impact on prices.
This analysis is for informational purposes only and should not be construed as financial advice. It's crucial to conduct thorough research and consult with a qualified financial advisor before making any investment decisions in the cryptocurrency markets.
By using this analysis, you acknowledge and accept the risks associated with cryptocurrency trading and agree to trade at your own discretion. The author of this analysis shall not be held responsible for any losses incurred as a result of using the information provided.

AuctionUSD ShortRisk warning, disclaimer: the above is a personal market judgment based on published information and historical chart data on Tradingview, all analysis is only subjective. Hope investors consider, I am not responsible for your investment decision. Thank you.
Good luck!

AUCTIONUSDT(AUCTION) Daily tf Range Updated till 30-05-24AUCTIONUSDT(AUCTION) Daily timeframe range. this thing got based PA and range level. pretty easy money if one can utilize the level trade either side. its failed to close over 27.03 once, trying again today. if it can get a clean close over 27.03 than 35.21 is open to visit.

$auctionthought id already posted this got a bag yesterday and its back where i got it
flip blue line and have a spike in supply zone and undertest of 200ema then retest 17.26 maybe take stops below that then run it back .
so IF it does play out like above shall look to lever up on the rertest
part of me wants that range low deviation but may not get it still shall check back in 8hrs

AUCTIONUSDT - BULLISHBINANCE:AUCTIONUSDT is currently creating higher highs and higher lows after experiencing bullish divergence. I am expecting the bullish momentum to continue as the lower high as been broken as well!

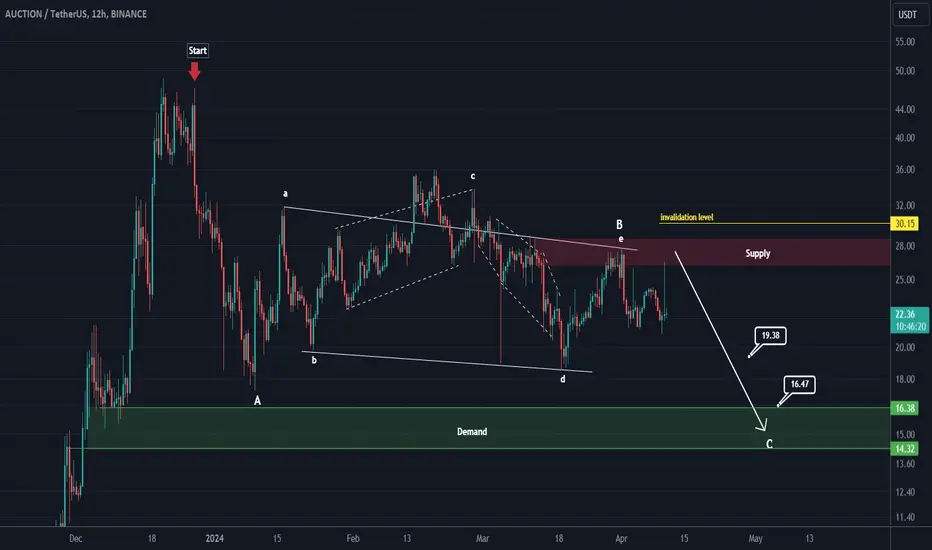
Auction looks bearishThe correction has started from where we entered "START" on the chart.
It seems that we are in an ABC or a more complicated pattern.
Now it looks like wave B, which was a triangle, is over. And we have entered bear C wave.
The targets are marked on the chart. When we reach the first target, save some profit and then change the stop to entry
Closing a daily candle below the invalidation level will violate the analysis
For risk management, please don't forget stop loss and capital management
Comment if you have any questions
Thank You
Bounce Token (AUCTION)After AUCTION broke the downtrend line, went up 1000% and now correction is unfolding in a triangle pattern. It seems, AUCTION is aiming for the ATH area that definitely will act as a major resistance. AUCTION would be free If break this area successfully, as there are no resistances. Let's see what happens.

#AUCTION/USDT#AUCTION
We have a strong bullish soft trend that the price has been following for two months
Now the rising trend has been touched and it is expected to rebound upward
We have a strong rising trend on RSI as well
We have a higher stability than the Moving Average 100 and we have an upward discount
The pattern is canceled if the day is closed with a strong bearish candle
Entry price 29.86
The first goal is 32.00
The second goal is 35.06
Third goal 38.54

AUCTIONUSD 3DAUCTION ~ 3D 📈
#AUCTION Bullish Pennant Pattern is Formed, Make purchases gradually from here, with a minimum Target of 20%+ From here 📈

AUCTIONUSDT DCA Buying Spot this under 22.
Pretty nice potential of a nice move in this one.
Looks like it can generate a nice Spot Trade from here.
Targeting 70 and 120.
Note: Not a Financial Advice.

AUCTION IN THE VERGE OF BREAKOUTAUCTION is trying to breakout from descending channel in daily timeframe. In case of breakout 100% pump is expected.
