AUDCAD Ready to go up.I enter in this pair with small lot to see if the price change the sentiment.
The normal is to see movement up tomorrow and next tomorrow.
blessings.
AUDCAD trade ideas

AUD-CAD Local Long! Buy!
Hello,Traders!
AUD-CAD will soon hit
A horizontal support level
Of 0.8888 after a sharp
Fall down but its a strong
Support so we will be
Expecting a rebound and
A local move up
Buy!
Comment and subscribe to help us grow!
Check out other forecasts below too!
Disclosure: I am part of Trade Nation's Influencer program and receive a monthly fee for using their TradingView charts in my analysis.

AUDCAD POSSIBLE BUY OPPORTUNITYprice is trending bullish from the H1 timeframe and we are looking forward to buying from the current market price. our target profit area is at the 0.90580

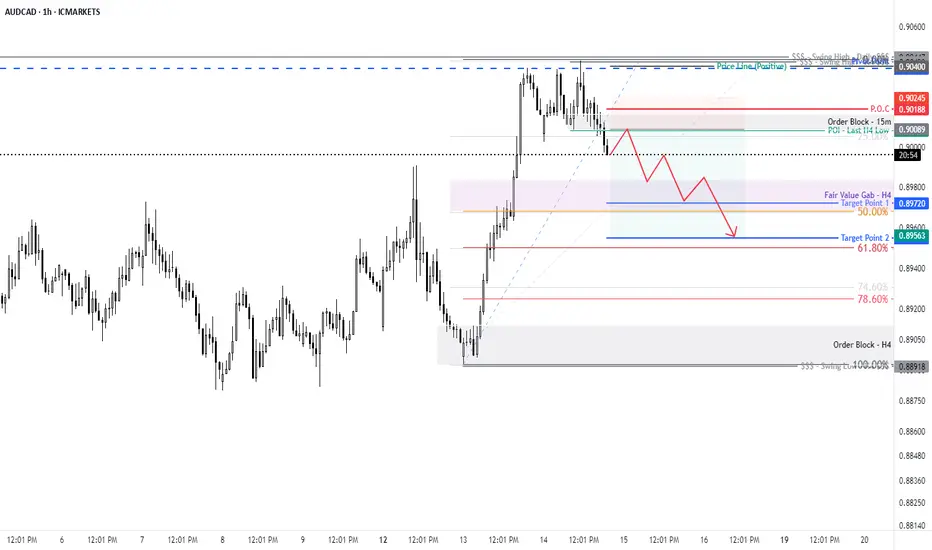
FUN TO BE HAD WITH AUDCAD SHORT FORECAST Q2 W21 D20 Y25THERE IS A LOT OF FUN TO BE HAD WITH OUR FRIEND ...
AUDCAD
AUDCAD SHORT FORECAST Q2 W21 D20 Y25
Professional Risk Managers👋
Welcome back to another FRGNT chart update📈
Diving into some Forex setups using predominantly higher time frame order blocks alongside confirmation breaks of structure.
Let’s see what price action is telling us today!
💡Here are some trade confluences📝
✅ Weekly order block
✅ Intraday 15 order block
✅Tokyo ranges to be filled
✅ Weekly 50 EMA
🔑 Remember, to participate in trading comes always with a degree of risk, therefore as professional risk managers it remains vital that we stick to our risk management plan as well as our trading strategies.
📈The rest, we leave to the balance of probabilities.
💡Fail to plan. Plan to fail.
🏆It has always been that simple.
❤️Good luck with your trading journey, I shall see you at the very top.
🎯Trade consistent, FRGNT X

AUDCAD SELLI’m looking to short AUD/CAD as a swing trade, and the reason is tomorrow’s interest rate decision from the Reserve Bank of Australia.
Markets expect the RBA to cut rates by 0.25%. If that happens—or if they sound more cautious about the economy—the Australian dollar could drop.
Lower interest rates usually make a currency less attractive. That’s bad for AUD.
At the same time, Canada’s central bank isn’t cutting rates. That makes the Canadian dollar stronger by comparison.
If the RBA does cut, I’ll watch for AUD/CAD to lose support on the daily chart. A lower high and a clean break down would be my entry signal.
This trade is based on fundamentals, not just a chart pattern. If the news confirms the setup, I’m in. Clear plan, managed risk, simple trade.

AUD/CAD For Bullishwait for pull-back near by entry point and then go long
general trend is up trend
have fun :)

AUDCAD Q2 W21 D19 Y25,SHORT RISK OFF ASAP ! We'll explain why...AUDCAD Q2 W21 D19 Y25 RISK OFF ASAP !
As per our most recent weekly trade forecast, we are indeed short biased & currently short AUDCAD. For those of you speculating with us, here I'll be quick in reason regarding why you should manage your risk effectively NOW. Whether that means rolling stops to half risk and or going breakeven, whatever risk management you use, the time is now.
Now here is why. Whilst, yes we do forecast but we also are hedging on reactions from price points of interests. The market does not know our lot sizes, nor our stop size nor our profit target.
Have we had the reaction from the POI? yes. Should that be good enough, YES!
In our opinion, in order to be successful trade, a robotic approach is required. To enter with minimal objectiveness. If the shoe fits and I like shoe is the one I've been waiting for then, it's simple. I try on the shoe. A lot like trading via a robotic approach, if the set up is the one that matches the catalog of setups that I acknowledge as a position, it is executed. With that said, the robotic approach works inline with when to know that its time to illuminate the potential for loss even though risk is always accepted, accepted, does not mean acceptable.
It is so very easy to be locked into a mindset that aligns with your current bias. exaggerated more so when you're in a position that stokes your thoughts ... BE MINDFUL of that. Stay robotic and try to illuminated self assurance. Look at price action with open eyes and hold no bias aside from the split second that you build your bias. then drop it and re evaluation continually. That I the "major key".
Remain open minded.
Remain Objective, not subjective.
Remember the aim. To print money.
Let’s see what price action is telling us NOW!
💡Here are some trade confluences📝
✅ Weekly order block
✅Intraday 15 order block
✅Tokyo ranges to be filled
✅ Weekly 50 EMA
🔑 Remember, to participate in trading comes always with a degree of risk, therefore as professional risk managers it remains vital that we stick to our risk management plan as well as our trading strategies.
📈The rest, we leave to the balance of probabilities.
💡Fail to plan. Plan to fail.
🏆It has always been that simple.
❤️Good luck with your trading journey, I shall see you at the very top.
🎯Trade consistent, FRGNT X

AUD/CAD BEARS ARE GAINING STRENGTH|SHORT
AUD/CAD SIGNAL
Trade Direction: short
Entry Level: 0.898
Target Level: 0.882
Stop Loss: 0.909
RISK PROFILE
Risk level: medium
Suggested risk: 1%
Timeframe: 12h
Disclosure: I am part of Trade Nation's Influencer program and receive a monthly fee for using their TradingView charts in my analysis.
✅LIKE AND COMMENT MY IDEAS✅

AUDCAD SHORTMarket structure bearish on HTFs DW
Entry at Both Daily and Weekly AOi
Weekly Rejection at AOi
Previous Structure point Weekly
Daily Rejection at AOi
Previous Structure point Daily
Around Psychological Level 0.89500
H4 EMA retest
H4 Candlestick rejection
Levels 5.21
Entry 100%
REMEMBER : Trading is a Game Of Probability
: Manage Your Risk
: Be Patient
: Every Moment Is Unique
: Rinse, Wash, Repeat!
: Christ is King.

AUD/CAD: Rejection in Play – Bears on Deck !!Price has reacted off resistance and is showing signs of weakness. With momentum turning bearish, we’re watching for a clean move to the downside.
🎯 Target: 0.88911
📌 (Not financial advice)
#AUDCAD #ForexSetup #BearishBias #SmartMoney #PriceAction #TechnicalAnalysis #FXTrading #AussieLoonie

AUDCAD Technical & Order Flow AnalysisOur analysis is based on multi-timeframe top-down analysis & fundamental analysis.
Based on our view the price will fall to the monthly level.
DISCLAIMER: This analysis can change anytime without notice and is only for assisting traders in making independent investment decisions. Please note that this is a prediction, and I have no reason to act on it, and neither should you.
Please support our analysis with a boost or comment!

AUDCAD Long Term buying Trading IdeaHello Traders
In This Chart AUDCAD HOURLY Forex Forecast By FOREX PLANET
today AUDCAD analysis 👆
🟢This Chart includes_ (AUDCAD market update)
🟢What is The Next Opportunity onAUDCAD Market
🟢how to Enter to the Valid Entry With Assurance Profit
This CHART is For Trader's that Want to Improve Their Technical Analysis Skills and Their Trading By Understanding How To Analyze The Market Using Multiple Timeframes and Understanding The Bigger Picture on the Charts

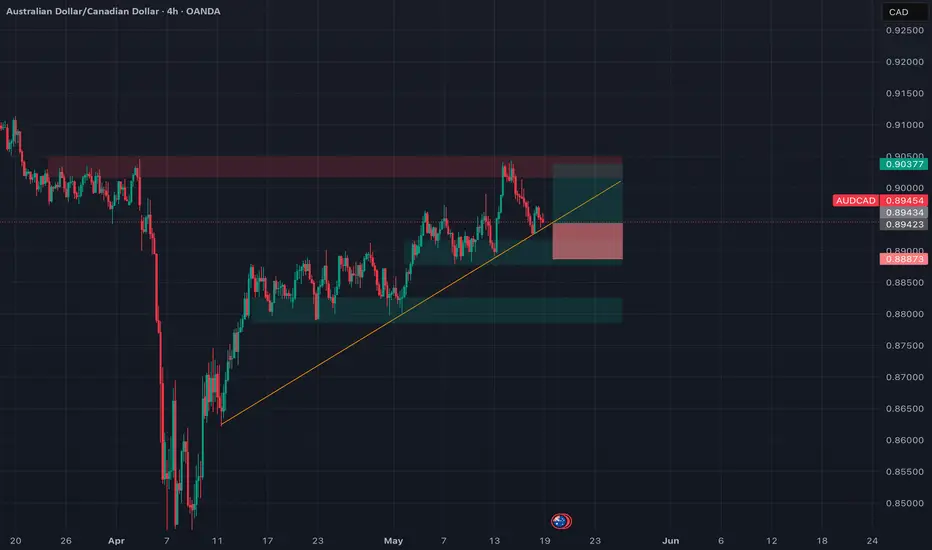
AUDCAD Long: Riding Aussie Strength vs Weak Loonie 🔹 Pair: AUD/CAD
🔹 Timeframe: 4H
🔹 Direction: Long
🔹 Strategy: Trend Continuation + Macro Confluence
🔹 Trade Active: 📍 0.8945 (CMP)
📊 Fundamental Bias
🇦🇺 AUD – Bullish
• Seasonal Surge: Historically strong from May 19 to June 10.
• Conditional Score Gain: AUD rose from 21 → 24 (momentum improving).
• Macro View: Inflation stabilizing, dovish stance offset by improving sentiment.
• VIX < 20: Risk-on conditions favor AUD.
🇨🇦 CAD – Bearish
• Flat Conditional Score: No improvement (2 → 2).
• Hawkish CB but Weak Data: CPI softening, trade risks persist.
• Global Sentiment: Oil stagnation + cautious BoC tone = headwinds for CAD.
⸻
🧠 Confluence Summary
✅ AUD macro + seasonal strength
✅ CAD remains fundamentally weak
✅ Risk-on supports commodity currencies
✅ 4H trendline support holding
⸻
🖼️ Technical Setup
• Entry: 0.8945
• Stop Loss: 0.8890 (below ascending trendline + support zone)
• Take Profit: 0.9036 (prior resistance + TP1)
• Risk:Reward: ~1.67
🟠 Optional Target: 0.9045 for extended move.
📌 Outlook
I’m bullish on AUDCAD for the week of May 19–23, supported by:
• Seasonal patterns
• Risk tone
• CAD stagnation
• Clear trend structure
Will look to trail SL as price closes above 0.8975. Clean invalidation below 0.8890.
⸻
💬 What’s your bias on AUD this week?
Drop a comment & let’s discuss 📉📈
AUDCAD SHORT FORECAST Q2 W21 Y25AUDCAD SHORT FORECAST Q2 W21 Y25
Professional Risk Managers👋
Welcome back to another FRGNT chart update📈
Diving into some Forex setups using predominantly higher time frame order blocks alongside confirmation breaks of structure.
Let’s see what price action is telling us today!
💡Here are some trade confluences📝
✅ Weekly order block
✅Intraday 15 order block
✅Tokyo ranges to be filled
✅ Weekly 50 EMA
🔑 Remember, to participate in trading comes always with a degree of risk, therefore as professional risk managers it remains vital that we stick to our risk management plan as well as our trading strategies.
📈The rest, we leave to the balance of probabilities.
💡Fail to plan. Plan to fail.
🏆It has always been that simple.
❤️Good luck with your trading journey, I shall see you at the very top.
🎯Trade consistent, FRGNT X

AUDCAD chart patterns analysisANALYST´S NOTE: Analysis done by me, text for my view on the charts is generated by screenshot sent to ChatGPT - Tommi Za
🔍 Technical Analysis
🧱 Market Structure & Setup
Price has reached a key descending trendline (marked with thick dashed line) that has held since late 2023 — major structural resistance.
A double top (HH) appears to be forming just below this level, suggesting potential reversal.
An ascending wedge is in play, and price is now threatening a breakdown from it.
Structure shows:
Higher lows (HL) into resistance.
Potential loss of bullish momentum near 0.90 psychological zone.
🧩 Confluences for Short Bias
Touch of the multi-month descending trendline.
Failure to break above horizontal resistance (orange line).
Loss of momentum from RSI, which is rolling over from near the 60 level — a typical rejection zone in downtrends.
Price closing below 50 EMA and threatening the wedge base confirms the loss of strength.
🎯 Trade Plan
Short bias below the wedge base.
Targeting demand zone marked in blue (0.8580–0.8650 approx.).
First confirmation comes on a clean break below trendline support + EMA rejection.
🧠 Fundamentals
🇦🇺 AUD – Weak Bias
The RBA is largely neutral now, with limited scope for hikes due to softening domestic demand.
Australian labor market is cooling, and CPI is under control.
Risk-off sentiment globally tends to hurt AUD, especially with falling commodity prices.
🇨🇦 CAD – Mixed but Firming Slightly
CAD is weaker recently due to falling oil, but relative to AUD, it has held ground better.
The BoC is also on pause but not under the same easing pressure as the RBA.
If oil stabilizes or risk sentiment improves, CAD could gain back some strength.
→ Net Fundamental View: Slightly Bearish AUDCAD
Both currencies are soft, but AUD is more exposed to global risk sentiment and slowing Chinese demand.
CAD's relative resilience and positioning near a major technical rejection area strengthens the short case.
📌 Summary
Factor Signal
Structure Rejection at long-term trendline, double top
Pattern Rising wedge, breaking down
RSI Rejection under 60, bearish momentum shift
EMAs Price stalling below key averages
Fundamentals AUD weaker than CAD in current environment
Target Demand zone ~0.858–0.865
Entry Trigger Breakdown + lower high or retest of structure
🧨 Risk Note:
If price flips above the current double top and holds, invalidate the short bias. A daily close above the wedge highs would signal trend continuation.

AUDCAD going bullin 9 May 2025, unemployment rate announced 6.9%. which is higher than forecast with 6.8%. Due to this news. there is a bull on Tuesday 13/05/2025. This indicate the market is going to long run. Break of structure and adjustment has completed. now is time enter into the market.

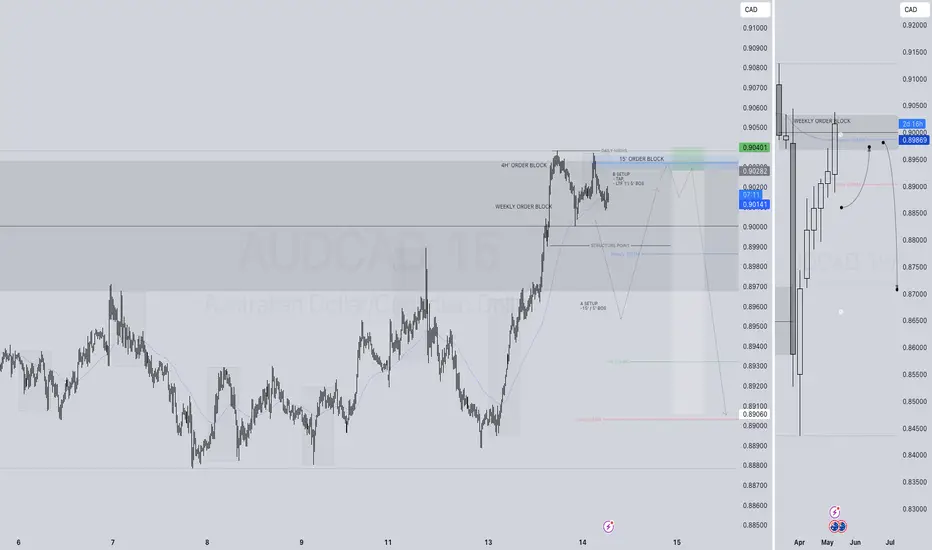
AUDCAD SHORT FORECAST Q2 W20 D15 Y25AUDCAD SHORT FORECAST Q2 W20 D15 Y25
Professional Risk Managers👋
Welcome back to another FRGNT chart update📈
Diving into some Forex setups using predominantly higher time frame order blocks alongside confirmation breaks of structure.
Let’s see what price action is telling us today!
💡Here are some trade confluences📝
✅ Weekly order block
✅Intraday 15 order block
✅Tokyo ranges to be filled
✅ Weekly 50 EMA
🔑 Remember, to participate in trading comes always with a degree of risk, therefore as professional risk managers it remains vital that we stick to our risk management plan as well as our trading strategies.
📈The rest, we leave to the balance of probabilities.
💡Fail to plan. Plan to fail.
🏆It has always been that simple.
❤️Good luck with your trading journey, I shall see you at the very top.
🎯Trade consistent, FRGNT X

AUDCAD SHORT FORECAST Q2 W20 D14 Y25AUDCAD SHORT FORECAST Q2 W20 D14 Y25
Professional Risk Managers👋
Welcome back to another FRGNT chart update📈
Diving into some Forex setups using predominantly higher time frame order blocks alongside confirmation breaks of structure.
Let’s see what price action is telling us today!
💡Here are some trade confluences📝
✅ Weekly order block
✅Intraday 15 order block
✅Tokyo ranges to be filled
✅ Trade towards the 50 EMA's on all time frames
🔑 Remember, to participate in trading comes always with a degree of risk, therefore as professional risk managers it remains vital that we stick to our risk management plan as well as our trading strategies.
📈The rest, we leave to the balance of probabilities.
💡Fail to plan. Plan to fail.
🏆It has always been that simple.
❤️Good luck with your trading journey, I shall see you at the very top.
🎯Trade consistent, FRGNT X
AUDCAD: Will Keep Growing! Here is Why:
Our strategy, polished by years of trial and error has helped us identify what seems to be a great trading opportunity and we are here to share it with you as the time is ripe for us to buy AUDCAD.
Disclosure: I am part of Trade Nation's Influencer program and receive a monthly fee for using their TradingView charts in my analysis.
❤️ Please, support our work with like & comment! ❤️

Steal the Show: AUD/CAD Bullish Bank Run!🌍 Greetings, Wealth Warriors & Market Mavericks! 👋😎💸
Hey there, global traders! Ready to crack the vault on the AUD/CAD "Aussie-Loonie" Forex Heist? 🏦💰 Based on our slick *Thief Trading System* blending technical precision and fundamental vibes, here’s the ultimate plan to snag profits. Follow the chart’s long-entry blueprint and aim to cash out near the high-stakes Red Zone—a wild spot where overbought signals, consolidation, and bearish traps lurk. 💪🎯 Stay sharp, grab your loot, and treat yourself—you’ve earned it! 🍾🚀
🔑 Entry 1: “The vault’s open! Spot the MA breakout at 0.90500 and dive in—bullish riches are calling!”
Pro move: Set buy stop orders above the Moving Average or buy limit orders at the latest 15/30-min swing low/high for pullback action. 📊 Add a chart alert to catch the breakout wave! 🌊
🔑 Entry 2: “The heist is on! Stalk the MA pullback in the Market Maker’s Trick Zone at 0.89200, then strike—fortune loves the fearless!”
🛑 Stop Loss: “Listen up, crew! 🗣️ For buy stop orders, hold off on setting that stop loss until the breakout kicks in. 🚀 Place it at the spot I’ve marked 📍, or go rogue at your own risk—don’t blame me if the market bites! 😜 Your trade, your rules, your fire. 🔥”
📍 Thief SL set at the nearest swing low on the 4H timeframe for swing trades.
📍 Size your SL based on your risk, lot size, and number of orders.
🎯 Target: 0.91500—or make a smooth exit near the target zone. 🏴☠️
👀 Scalpers, heads up: Stick to long-side scalps. Got deep pockets? Jump in now! Otherwise, team up with swing traders for the grand heist. Use trailing SL to lock in your cash. 💰🔒
📡 Why’s AUD/CAD hot? The "Aussie-Loonie" is riding a bullish surge, fueled by key drivers. 📰 Dive into fundamentals, COT reports, sentiment analysis, intermarket trends, and future projections. Check the linkss for fundamentals, macro trends and market outlooks for the full scoop! 🔗🌐
⚠️ Trading Alert: News Flash & Position Safety 🗞️🚨
News drops can shake the market like a storm. 🌪️ To protect your trades:
- Skip new entries during news releases. 🚫
- Use trailing stop-loss orders to secure profits and shield your positions. ✅
💥 Boost Our Heist! 💪 Hit that Boost Button to supercharge our Thief Trading squad. 💸 Crush the market daily with our slick strategies. Together, we’ll stack profits with ease! 🤝❤️🎉
Catch you at the next heist, traders—stay locked in for more! 🤑🐱🚀✨

AUDCAD Bullish Momentum: Pullback Setup in Play!📈 AUD/CAD Technical Outlook 📈
I’m currently analyzing the AUD/CAD currency pair, and it's showing a strong, sustained bullish trend on the daily timeframe 🔥. We’re seeing a clean sequence of higher highs and higher lows, which keeps my bias firmly bullish ✅.
I’m waiting for a pullback into equilibrium — that’s around the 50% level of the current or previous price range 🎯. If price retraces into this zone, I’ll be looking for a high-probability entry setup on the 4H and 30-minute timeframes ⏱️.
🎯 Target: Previous daily highs, as marked in the video.
This setup aligns with classic trend continuation principles, and I’ll be watching for confirmation before executing any trade.
⚠️ Disclaimer: This is not financial advice. Always trade based on your own analysis and risk management rules. 💼📊

AUDCAD - SNIPER PRECEISE SHOT SELLING ENTRY - FIB GOLDEN LEVELHI Guyz, Based on sentiments of traders across the globe , 93 % of the traders are currently looking at selling the AUDCAD. I anticipate this would retrace to the 0.382 Level of FIB and take this opportunity to short sell.
Formation of Shooting Star candle stick pattern further confirms the possibility that HH is formed and now it will take corrective move.
STOP LOSS and TP1, TP2 and TP3 are defined with R:R of 1:1, 1:2 and 1:3 respectively.
Happy Trading and Thanks Me later !
Regards,
ProTradeProfessor!

AUD/CAD For Bearish as pull-backyou can go short now
general trend is up trend
current phase is pull-back
have fun :)