audcad sell tradeThe Relative Strength Index (RSI) is showing a downward trend, indicating weakening momentum. Additionally, the Moving Average Convergence Divergence (MACD) is showing a bearish crossover, further supporting the potential for a downward move
AUDCAD trade ideas

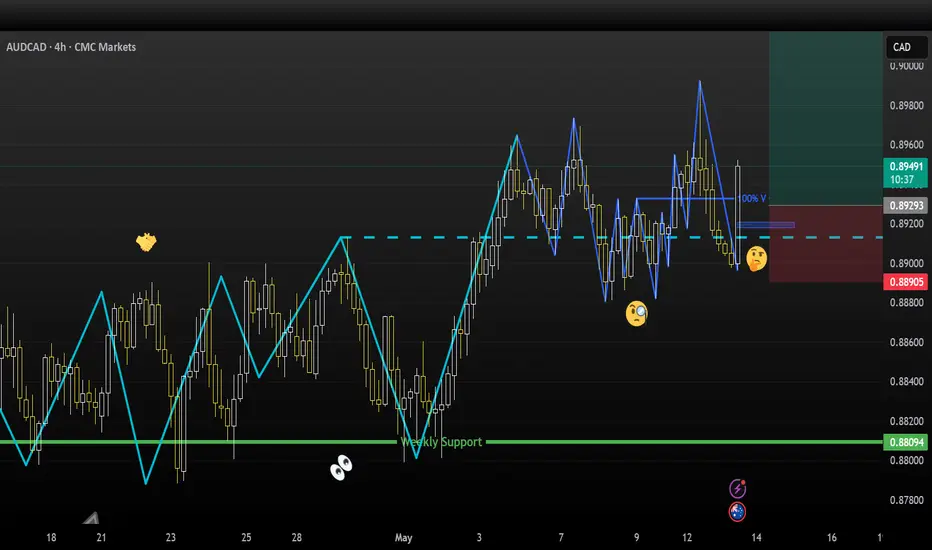
AUDCAD - Potential BuyBIAS: BUY
4Hour Chart:
Logical Analysis:
Observation of Seller Activity:
Earlier in April, it’s like the Store had way too much AUD/CAD to sell at the price near 0.89–0.90. But no one was buying at that level.
So what did the Store have to do? It gave a massive discount, slashing the price quickly to try and attract buyers. That’s why we saw such a sharp drop—it was a clearance move.
But when the price hit around 0.84413, the discount finally worked. People started buying, and the Store no longer needed to keep dropping the price.
Since then, the Store (sellers) hasn’t been able to offer that kind of aggressive discount again. That tells us their inventory pressure has eased, or they just aren’t as active anymore.
Observation of Buyer Activity:
As soon as that big discount hit bottom (around 0.84413), buyers rushed in quickly.
They didn’t just buy a little. It looks like buyers were willing to buy at a higher price too which pushed the price up fast, all the way to around 0.88094, meaning demand was strong at those low prices.
Since then, buyers have been steadily showing up, even if not with the same rush. They’re still holding up the shelves, keeping price above the recent support zone.
The Store has found some buyers and i believe that it will not give a discount, buyers are happy and are saying, “We’re happy to keep buying here.”
What This Tells Us:
The Store couldn’t sell at high prices, so it was forced to lower them dramatically.
That discount sparked strong demand, and since then, the buyers have controlled the floor.
The Store has tried to offer smaller sales since then, but buyers scoop up the product before it drops too much.
Conclusion (Buy Bias Confirmed):
The big sell-off was just the Store offloading excess stock at a discount.
Buyers responded fast and haven’t stopped showing up, especially near that 0.88094 mark.
As long as the shelves stay cleared at this price and the Store doesn’t feel pressure to discount again, buying is the side with the stronger hand.
Technical Analysis: on the chart
Good Luck :)
AUDCAD is BearishPrice was in an uptrend, however bearish divergence has emerged alongside triple top, which hints bearish control over price action. If previous higher low is broken with good volume then we can expect further slide in price as per Dow theory. Targets are mentioned on the chart.

AUD_CAD FALLING RESISTANCE|SHORT|
✅AUD_CAD is trading along
The falling resistance
And as the pair will hit it soon
I am expecting the price to go down
To retest the demand levels
Below around 0.8987
SHORT🔥
✅Like and subscribe to never miss a new idea!✅
Disclosure: I am part of Trade Nation's Influencer program and receive a monthly fee for using their TradingView charts in my analysis.

AUDCAD Shows Strength – Bullish Signals UpsideAfter going down, AUDCAD looks like it's starting to rise again. The price has broken above the downtrend resistance line, which suggests that selling pressure is weakening and buyers are taking control. If this breakout holds, the pair could continue moving up, with the next target around the 0.9030 level.

AUDCAD Technical Analysis! SELL!
My dear friends,
Please, find my technical outlook for AUDCAD below:
The instrument tests an important psychological level 0.9001
Bias - Bearish
Technical Indicators: Supper Trend gives a precise Bearish signal, while Pivot Point HL predicts price changes and potential reversals in the market.
Target - 0.8965
About Used Indicators:
Super-trend indicator is more useful in trending markets where there are clear uptrends and downtrends in price.
Disclosure: I am part of Trade Nation's Influencer program and receive a monthly fee for using their TradingView charts in my analysis.
———————————
WISH YOU ALL LUCK

AUDCAD Is Very Bullish! Buy!
Here is our detailed technical review for AUDCAD.
Time Frame: 1D
Current Trend: Bullish
Sentiment: Oversold (based on 7-period RSI)
Forecast: Bullish
The market is approaching a significant support area 0.898.
The underlined horizontal cluster clearly indicates a highly probable bullish movement with target 0.913 level.
P.S
Overbought describes a period of time where there has been a significant and consistent upward move in price over a period of time without much pullback.
Disclosure: I am part of Trade Nation's Influencer program and receive a monthly fee for using their TradingView charts in my analysis.
Like and subscribe and comment my ideas if you enjoy them!

AUD/CAD For Bullishwait for pull-back near by entry point and then go long
general trend is up trend
have fun :)

Sell AUDCADAUDCAD plans for the rest of the week and possibly next week. I see a double top emerging. I believe it is safe to sell now

AUD/CAD - Is this a turning point?!We are currently sitting at a very high-probability area for potential downside continuation!
🔎 Key Observations:
Elliott Wave Count: We have completed waves (1)-(3) and are currently finalizing a corrective wave (4) into a critical supply zone.
71% Fib Retracement: Price has retraced deep into a typical exhaustion zone for wave (4) setups — extremely common before the major trend resumes.
Supply Zone: Clear rejection visible near 0.90500 area; price is showing early signs of weakness.
MACD: Bearish cross aligned perfectly with supply pressure. Momentum indicators are favoring bears.
Volume Spike: High volume during the wave (3) selloff confirms real seller presence behind this move.
📈 My Plan:
Watching for bearish confirmation (weak candles, rejections) in this supply zone.
Expecting a potential wave (5) extension lower, targeting sub-0.82000s over the next several months.
Risk Management: Stops placed above 0.9100 structure if activated.
📢 Summary:
The trend is still bearish — we are just seeing a corrective rally.
Big money tends to load shorts on these pullbacks...
Don’t miss this potential monster setup! 🔥
💬 Drop a comment if you're watching AUD/CAD too!
🔔 Follow me for more high-probability setups each week!
#Forex #AUDCAD #ElliottWave #SupplyAndDemand #TradingSetup #SwingTrade #Bearish
Would you also like me to make a second version that's even shorter (for quick engagement) or one that sounds a bit more aggressive and hyped (depending on the style of your audience)? 🎯

Clean Entry,Entry
AUDCAD - 12/05/25 time 11.38
Asian highs taken out aiming for Asian lows
3pin on right shoulder
fib 78.6 exactly
US Dollar Index posts over 1% gain after China and US announce a 90-day tariff truce.
Fed’s Kugler says assessing economy remains difficult amid trade shifts and household stockpiling.
US 10-year Treasury yield spikes to 4.45%, supporting USD through widening rate differentials.
Markets price out 2025 Fed rate cuts as risk appetite surges globally.


AUUDCAD SHORTMarket structure bearish on HTFs 3
Entry at Both Daily and Weekly AOi
Weekly Rejection at AOi
Previous Structure point Weekly
Daily Rejection at AOi
Previous Structure point Daily
Around Psychological Level 0.89500
H4 Candlestick rejection
Levels 5.21
Entry 105%
REMEMBER : Trading is a Game Of Probability
: Manage Your Risk
: Be Patient
: Every Moment Is Unique
: Rinse, Wash, Repeat!
: Christ is King.

AUDCAD ENTRY CHART On this pair, we are still BULLISH IN TREND, even though we had a strong push on the CANADIAN DOLLAR , during the open of LONDON SESSION,here we have this pair still in an UPTREND, our Entry is based on the ZONE created,plus IND, with other of our Confluences, if price comes to tag us, we will be IN, and we move BE after +1r, if this setup matches with your idea and approach you can add to your watchlist, WE WILL GIVE UPDATE in the comment sections.

AUDCAD Bullish continuation AUDCAD in bullish trend, expected to be in a bullish continuation pattern, for conformation entry with buy stop above the last high and the resistance lever. RR 1:1

Sell zone at 0.89731Trading Journal Entry –
Trade Setup:
Currently watching a sell opportunity around the 0.89731 zone, with a strong buy level identified near 0.88170.
Rationale:
The 0.89731 level aligns with a notable resistance zone on the H4 and Daily charts, where price has previously encountered selling pressure. The recent bullish move appears to be testing this area again, and early signs of bullish exhaustion suggest a potential reversal. Price action near this zone has shown repeated rejection wicks and stalling momentum, which adds confluence for a short-term sell setup.
Meanwhile, the 0.88170 zone marks a major support level that has historically attracted strong buying interest. This level aligns with a prior accumulation area and could serve as a high-probability reversal point if price moves lower. The plan is to take profit from the short trade near this zone and look for a potential long setup, ideally supported by bullish confirmation on lower timeframes.

AUDCAD ... Top of The Week ... Potential Bullish MoveAUDCAD ... Top of The Week ... Potential Bullish Move
.
By: Noble.Mike.Jamison


AUDCAD | Sideways AUDCAD is not printing any new higher highs or lower lows.Instead it is moving in sideways.

AUD/CAD BEARS WILL DOMINATE THE MARKET|SHORT
Hello, Friends!
We are now examining the AUD/CAD pair and we can see that the pair is going up locally while also being in a uptrend on the 1W TF. But there is also a powerful signal from the BB upper band being nearby, indicating that the pair is overbought so we can go short from the resistance line above and a target at 0.887 level.
Disclosure: I am part of Trade Nation's Influencer program and receive a monthly fee for using their TradingView charts in my analysis.
✅LIKE AND COMMENT MY IDEAS✅

AUDCAD Will Go Lower! Short!
Take a look at our analysis for AUDCAD.
Time Frame: 1h
Current Trend: Bearish
Sentiment: Overbought (based on 7-period RSI)
Forecast: Bearish
The market is on a crucial zone of supply 0.890.
The above-mentioned technicals clearly indicate the dominance of sellers on the market. I recommend shorting the instrument, aiming at 0.888 level.
P.S
Please, note that an oversold/overbought condition can last for a long time, and therefore being oversold/overbought doesn't mean a price rally will come soon, or at all.
Disclosure: I am part of Trade Nation's Influencer program and receive a monthly fee for using their TradingView charts in my analysis.
Like and subscribe and comment my ideas if you enjoy them!

Sell AUDCADA beautiful scenario is at play here. First the bearish triangle pattern which price has already broken out of. Then, a triple top or head and shoulders pattern could also be at play. Then lastly, we can see price is moving in a downtrend within the channel drawn by a bearish flag pattern

audcadThe Relative Strength Index (RSI) is showing an upward trend, indicating increasing momentum. Additionally, the Moving Average Convergence Divergence (MACD) is showing a bullish crossover, further supporting the potential for an upward move.
