AUDCAD for next weekI don't want to stay away from this pair even after a loss of 800$ lol. but win and loss are always aside, kinda like the Substance movie Sue x Eliz that I love :)
2 scenarios:
- strong pullback at premium level down to 20-30% fib, good to go for TGIF setup (but it maybe too late night at JST, I will pass)
- pullback after filling the premium FVG, either way I look for short. or the chart would tell me something else.
AUDCAD trade ideas

AUDCAD a loss :(Can anyone tell me what is happening with this pair? It's creating weekly high, tapping into the premium zone, not even stop once to breath lol. it's hard to accept this loss because the setup was a perfect A trade...but yeah maybe my bias was too strong and I'm stubborn.
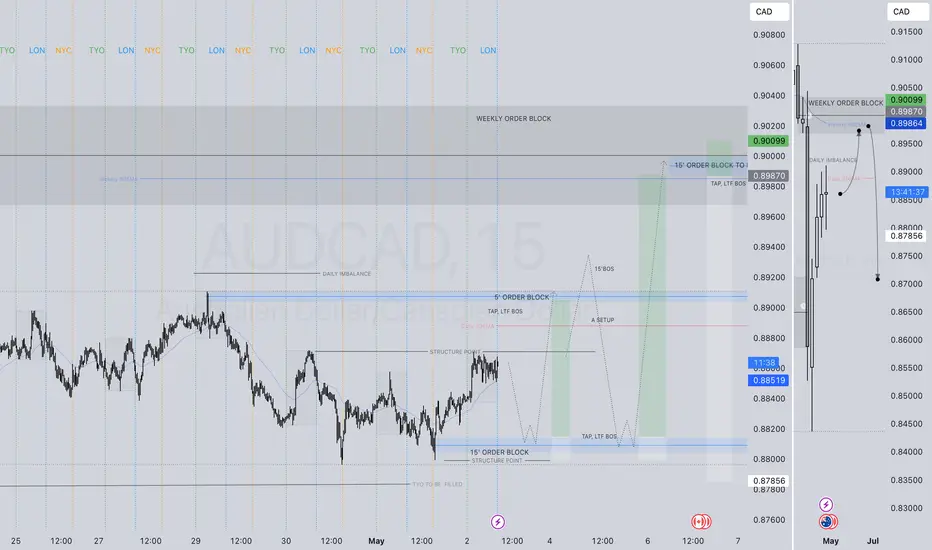
AUDCAD LONG FORECAST Q2 W18 D2 Y25AUDCAD LONG FORECAST Q2 W18 D2 Y25
Professional Risk Managers👋
Welcome back to another FRGNT chart update📈
Diving into some Forex setups using predominantly higher time frame order blocks alongside confirmation breaks of structure.
Let’s see what price action is telling us today!
💡Here are some trade confluences📝
✅Daily 50 EMA
✅Intraday 15' order block
✅Tokyo ranges to be filled
✅Intraday bullish breaks of structure to be confirmed
🔑 Remember, to participate in trading comes always with a degree of risk, therefore as professional risk managers it remains vital that we stick to our risk management plan as well as our trading strategies.
📈The rest, we leave to the balance of probabilities.
💡Fail to plan. Plan to fail.
🏆It has always been that simple.
❤️Good luck with your trading journey, I shall see you at the very top.
🎯Trade consistent, FRGNT X
AUDCAD SHORT FORECAST Q2 W18 D2 Y25AUDCAD SHORT FORECAST Q2 W18 D2 Y25
Professional Risk Managers👋
Welcome back to another FRGNT chart update📈
Diving into some Forex setups using predominantly higher time frame order blocks alongside confirmation breaks of structure.
Let’s see what price action is telling us today!
💡Here are some trade confluences📝
✅Daily 50 EMA
✅Intraday 5' order block
✅Tokyo ranges to be filled
✅Intraday bearish breaks of structure to be confirmed
🔑 Remember, to participate in trading comes always with a degree of risk, therefore as professional risk managers it remains vital that we stick to our risk management plan as well as our trading strategies.
📈The rest, we leave to the balance of probabilities.
💡Fail to plan. Plan to fail.
🏆It has always been that simple.
❤️Good luck with your trading journey, I shall see you at the very top.
🎯Trade consistent, FRGNT X

Short-Term Bullish, Cautious (NFP impact)Yesterday was largely bearish as AUDCAD failed to break above 0.88453, forming a triple bottom around 0.88000, then bouncing about 40 pips.
Today we’ve seen a clean break of 0.88453, followed by a 1H double top.
I’ll be watching closely for a retest of 0.88453 — if price creates support, I’ll look to enter long:
🥇 First target: recent highs for ~30 pips
🥈 Second target: 0.88983 (~25 more pips)
⚠️ It’s NFP Friday, so I’ll be cautious with entries and avoid overtrading.

AUDCADhello trader, here is another swing.. price is making bearish momentum (using Mcad as indicator)... price also filled the fvg of 4hrs and price is in distribution phase.. and breakout can happen anytime.. our target is first OB for double bottom or breakout of previous low to reach weekly OB (for all time low).. at the moment we are in breaish Mcad zone... also for NZDCAD you expect the same setup..
goodluck

AUD/CAD Is in bearish mode. good opportunity for trade.AUD/CAD Is in bearish mode. good opportunity for trade.

AUDCAD SELL OPPORTUNITY From the H1 perspective , a sell opportunity is envisaged from the current market price after we had a shift in market structure to the downside which signifies a bearish trend resumption.
Overall trend of the market remains bearish therefore, this is an opportunity to capitalize on the bear trend.


SHORT TRADE ON AUD/CAD ON 4H TF. Here AUD/CAD giving us multiple entries.
Two market changing patterns formed.
1-> we can enter on breakout of previous HL.
2-> or we can enter on the breakout of S 2.

AUDCAD: Expecting Bullish Movement! Here is Why:
Looking at the chart of AUDCAD right now we are seeing some interesting price action on the lower timeframes. Thus a local move up seems to be quite likely.
Disclosure: I am part of Trade Nation's Influencer program and receive a monthly fee for using their TradingView charts in my analysis.
❤️ Please, support our work with like & comment! ❤️

AUDCAD: Bearish Wave Continues 🇦🇺🇨🇦
I think that there is a high chance that AUDCAD
will continue falling from the underlined yellow resistance.
Next support - 0.8818
❤️Please, support my work with like, thank you!❤️
I am part of Trade Nation's Influencer program and receive a monthly fee for using their TradingView charts in my analysis.

AUDCAD SHORT FORECAST Q2 W18 D30 Y25AUDCAD SHORT FORECAST Q2 W18 D30 Y25
Professional Risk Managers👋
Welcome back to another FRGNT chart update📈
Diving into some Forex setups using predominantly higher time frame order blocks alongside confirmation breaks of structure.
Let’s see what price action is telling us today!
💡Here are some trade confluences📝
✅Daily 50 EMA
✅Intraday 5' order block
✅Tokyo ranges to be filled
✅Intraday bearish breaks of structure to be confirmed
🔑 Remember, to participate in trading comes always with a degree of risk, therefore as professional risk managers it remains vital that we stick to our risk management plan as well as our trading strategies.
📈The rest, we leave to the balance of probabilities.
💡Fail to plan. Plan to fail.
🏆It has always been that simple.
❤️Good luck with your trading journey, I shall see you at the very top.
🎯Trade consistent, FRGNT X

AUD/CAD For Bearishwait for pull-back near by entry point and then go short
general trend is up trend
current phase is pull-back
have fun :)

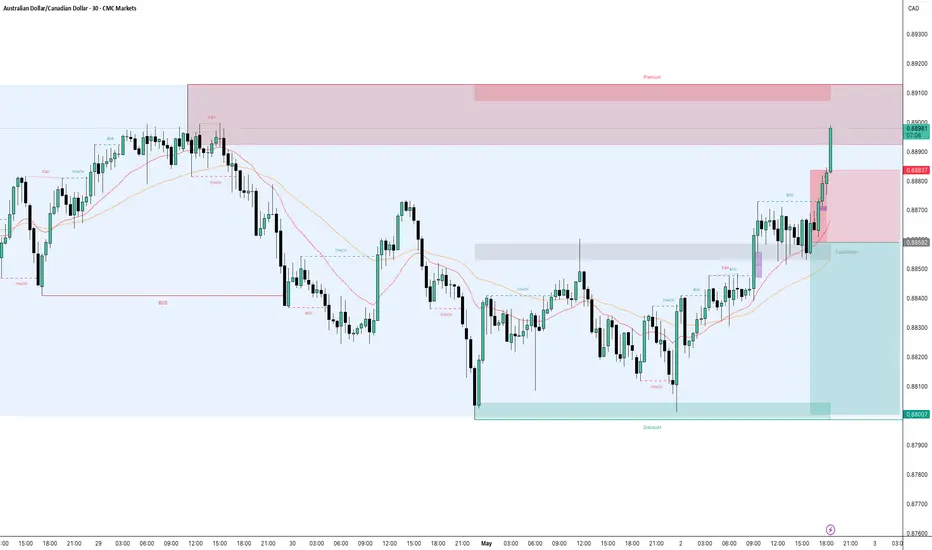
AUDCAD Still Ranging — Watch These Breakout ZonesAUDCAD remains stuck in a tight 50 pip range between 0.88499 and 0.88983 🌀
We’re still playing the same zones from yesterday’s analysis.
📌 Areas of interest remain:
Break above 0.88983 for potential continuation
Next key level: 0.89514
Until then, it's a waiting game.

AUDCAD FORMS A SYMMETRICAL TRIANGLE IN H1 TFPrice has been in a consolidation for a while and we anticipate a breakout real soon. A break below 0.88425 increase a probably of price trading lower to 0.87912


AUDCAD SHORT FORECAST Q2 W18 D29 Y25AUDCAD SHORT FORECAST Q2 W18 D29 Y25
Professional Risk Managers👋
Welcome back to another FRGNT chart update📈
Diving into some Forex setups using predominantly higher time frame order blocks alongside confirmation breaks of structure.
Let’s see what price action is telling us today!
💡Here are some trade confluences📝
✅Daily 50 EMA
✅Intraday 15' order block to be created
✅Tokyo ranges to be filled
✅Intraday bearish breaks of structure to be confirmed
🔑 Remember, to participate in trading comes always with a degree of risk, therefore as professional risk managers it remains vital that we stick to our risk management plan as well as our trading strategies.
📈The rest, we leave to the balance of probabilities.
💡Fail to plan. Plan to fail.
🏆It has always been that simple.
❤️Good luck with your trading journey, I shall see you at the very top.
🎯Trade consistent, FRGNT X

AUDCAD short setupAUD/CAD Short Trading Plan (Daily Timeframe)
Simple Setup:
Wait for price to approach and test the 20-day SMA (currently around 0.88419)
Look for a clear rejection from this level, shown by a bearish daily candle
Major resistance zone: moving average, and resistance retest
Break of support level
Entry:
Enter short on daily close below 0.88419 after MA rejection or bearish candle
Stop Loss:
Place stop 80 pips above entry or just above the 0.9000 resistance
Take Profit:
TP1: 0.8620
TP2: 0.8510
Key Rules:
Only enter if daily candle shows clear rejection from SMA
Maintain 1:2 risk-reward ratio minimum
Be patient and wait for proper setup on daily timeframe
Monitor daily close for confirmation


Incoming sells?! AUDCAD bearish sentiment Good day traders, I’m back with another setup on AudCad. Before I go into the thinking behind this setup I’d like to remind you that on the higher TF’s we still very much bearish that’s is my reasoning behind the bearish sentiment.
On Tuesday we saw price close lower to give us our high of the week but price has been disrespecting the high since Wednesday but failing to close above that high showing strength lower(Friday bearish candle). Going into the new week I believe we can expect price to keep disrespecting the high because we believe that CAD is gonna be weak but keeping the overall direction in mind(bearish) we do not wanna see price closing higher than the Tuesday’s high of the day.
4H we have shifted structure lower but price is still trading in the premium area, should price not fall below the low of previous week than we can expect manipulation higher to fill the FVG on the Weekly before continuing lower.

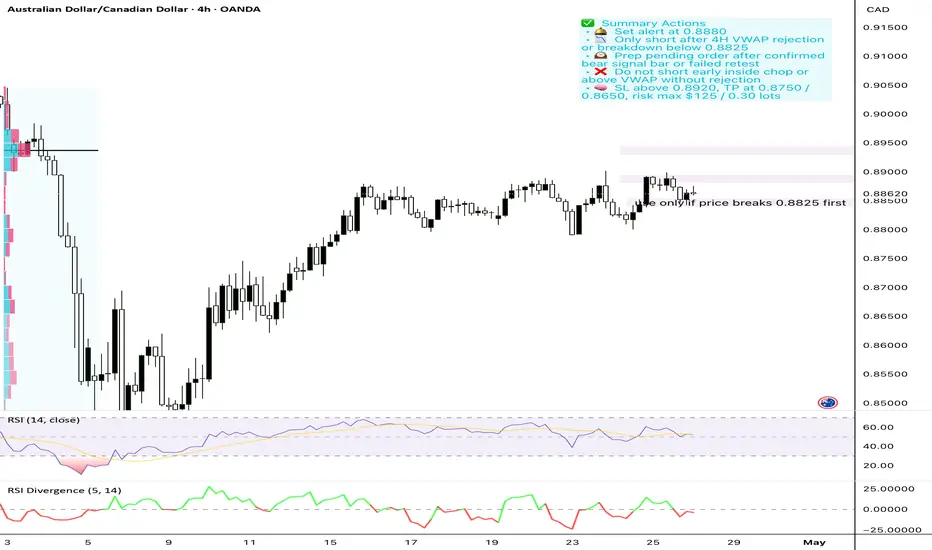
AUDCAD: B+ → A if bear signal forms under VWAP on Mon/TueA page from my trading journal. Please take it with a grain of salt, as I’m still learning and growing 🌟