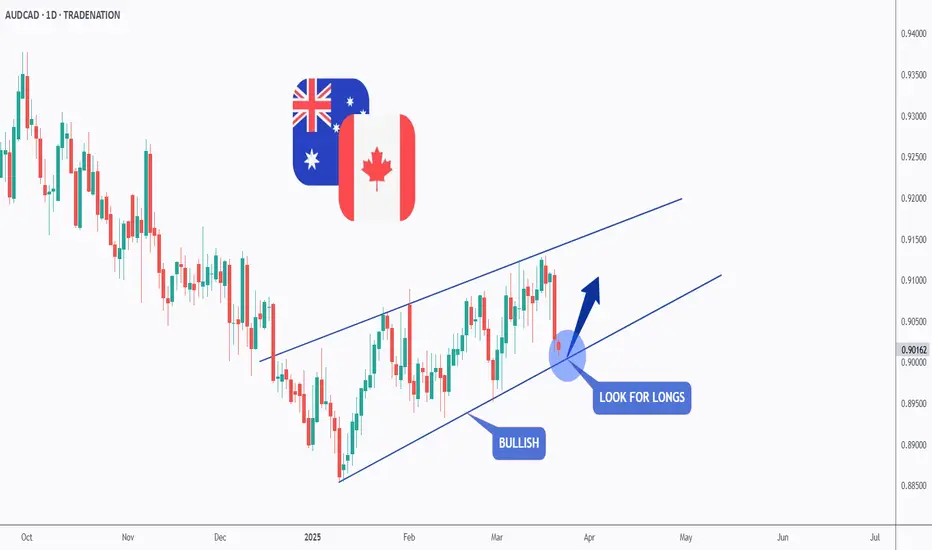
AUDCAD | Reoccurring FractalsWe're looking at 3 complete fractals and the fourth one being the current one. Same phase as the last, a bit of sideways trading/consolidation then aggressive buying breaking out to the upside.
Price action has been trending upwards with HHs and HLs and we're currently at a Lower High bouncing off the lower trendline below.
Would be ideal to look for long positions only for this setup as bulls are looking stronger from this view.
~300pips going into the 3rd wave.
AUDCAD trade ideas

AUDCAD Approaching Key Support - Rebound Towards 0.90150?OANDA:AUDCAD is approaching a significant support zone, highlighted by previous price reactions and strong buying interest. This area has previously acted as a key demand zone, increasing the likelihood of a bounce if buyers step in.
The current market structure suggests that if the price confirms support within this zone, we could see a bullish reversal. A successful rebound could push the pair toward the 0.90150 level, a logical target based on previous price behavior and current market structure.
However, if the price fails to hold this support and breaks below the zone with momentum, the bullish outlook may be invalidated, potentially opening the door for further downside continuation. Monitoring price action and volume in this area will be crucial to confirm a valid setup.
Just my take on support and resistance zones—not financial advice. Always confirm your setups and trade with solid risk management.
Best of luck!

AUDCAD: Bearish Move From Resistance 🇦🇺🇨🇦
There is a high chance that AUDCAD will retrace from the intraday resistance.
A bearish movement after an extended consolidation on an hourly time frame
provides a reliable bearish signal.
I expect a down movement at least to 0.901
❤️Please, support my work with like, thank you!❤️
I am part of Trade Nation's Influencer program and receive a monthly fee for using their TradingView charts in my analysis.

AUDCAD: Important Zone Detected 🇦🇺🇨🇦
I see a test of a significant supply zone on AUDCAD.
It is based on a recently broken horizontal support cluster
and a rising trend line.
I believe that the selling orders will accumulate within that area.
Chances will be high that the price will drop from that at least to 0.898 support.
❤️Please, support my work with like, thank you!❤️
I am part of Trade Nation's Influencer program and receive a monthly fee for using their TradingView charts in my analysis.

AUD/CAD Buyers Aim to Establish a Short-Term UptrendTechnical Analysis
On the hourly chart, AUD/CAD is attempting to complete a short-term bullish reversal pattern that began forming after the pair established a base at the psychological level of 0.90000. Buyers have successfully pushed the price above the resistance at 0.90189, gaining proximity to the 100-period moving average—a key area of interest.
A sustained move above 0.90240 would confirm bullish continuation, exposing the next upside targets at 0.90306, 0.90378, and 0.90495. Momentum indicators support this scenario, as RSI trends higher and MACD shows expanding bullish bars.
However, if sellers return and drive the price below 0.90000, the bullish setup would be invalidated, suggesting a renewed downside risk.
Fundamental Drivers
With no major releases from Canada, the focus shifts to Australian fundamentals. February’s PMI rebound suggests resilience in the Australian economy, providing a fundamental backdrop for AUD strength. Market participants will remain attentive to upcoming data, but in the short term, sentiment appears to favour the Aussie.

Buy audcadAUD/CAD Reversal Trade Setup: Key Levels to Watch
Market Overview
The AUD/CAD currency pair has shown a strong historical support level around 0.89867, where price has consistently bounced in previous weeks. This suggests a potential bullish reversal in the short term.
Trade Setup
Entry: Buy at 0.90246
Stop Loss (SL): 0.89867 (below key support level)
Take Profit (TP): 0.91212 (next major resistance level)
Analysis & Rationale
Technical Support Zone: The 0.89867 area has acted as a strong demand zone, reinforcing a possible price rebound.
Risk-to-Reward Ratio: This setup offers a favorable risk-to-reward ratio, ensuring optimal risk management.
Trend Confirmation: A confirmed bounce off support will provide further confidence in the bullish momentum.
Trading Plan & Execution
Wait for a clear bullish confirmation at 0.90246 before entering.
If price action aligns with expectations, gradually add positions on pullbacks while maintaining stop-loss discipline.
Close the trade at 0.91212 or trail stop to maximize gains if momentum remains strong.
This trade idea aligns with technical analysis principles, leveraging key support and resistance levels. However, always monitor market conditions, and adjust accordingly to maximize profitability.
📌 Risk Warning: Always use proper risk management strategies, and trade according to your personal risk tolerance.

AUDCAD ShortAUDCAD is now net short on the regression break - it now break the uptrend that has been running for 43 day straight.
I am considering my options.

AUD-CAD Bearish Breakout! Sell!
Hello,Traders!
AUD-CAD made a bearish
Breakout of the key horizontal
Level of 0.9022 which is now
A resistance and the breakout
Is confirmed so we are bearish
Biased and we will be expecting
A further move down
Sell!
Comment and subscribe to help us grow!
Check out other forecasts below too!
Disclosure: I am part of Trade Nation's Influencer program and receive a monthly fee for using their TradingView charts in my analysis.

AUDCAD - Sell Trade SetupLooking to go short. Waiting for slight pullback to upside to then sell.
Leave a comment below, let me know what you think. Share with friends. Check out my profile for more awesome trade plans and setups
Trade Safe - Trade Well.
~Michael Harding CEO at LEFTURN

AUD_CAD SHORT SIGNAL|
✅AUD_CAD is going down
And the pair made a bearish
Breakout of the key horizontal
Level of 0.9007 which is now
A resistance so we are bearish
Biased and we will be able
To enter a short trade on Monday
With the TP of 0.8970 and
The SL of 0.9030
SHORT🔥
✅Like and subscribe to never miss a new idea!✅
Disclosure: I am part of Trade Nation's Influencer program and receive a monthly fee for using their TradingView charts in my analysis.

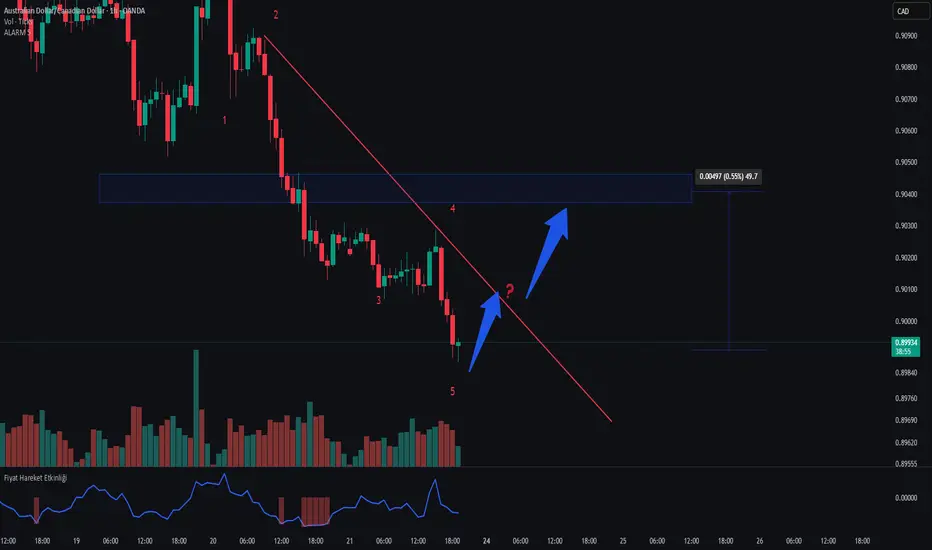
AUDCAD – Is the Downward Impulse Wave Coming to an End?It appears that the 1-5 impulse wave is reaching its final stages. However, in corrective structures, it's common to see waves like W-Y, W-Z, or extended patterns that mimic impulse waves.
For that reason, it's crucial to wait for a confirmed break of the descending trendline before considering a reversal or entry. Patience and confirmation are key. 🔍📉

AUDCAD Set To Grow! BUY!
My dear followers,
I analysed this chart on AUDCAD and concluded the following:
The market is trading on 0.9004 pivot level.
Bias - Bullish
Technical Indicators: Both Super Trend & Pivot HL indicate a highly probable Bullish continuation.
Target - 0.9048
Safe Stop Loss - 0.8977
About Used Indicators:
A super-trend indicator is plotted on either above or below the closing price to signal a buy or sell. The indicator changes color, based on whether or not you should be buying. If the super-trend indicator moves below the closing price, the indicator turns green, and it signals an entry point or points to buy.
Disclosure: I am part of Trade Nation's Influencer program and receive a monthly fee for using their TradingView charts in my analysis.
———————————
WISH YOU ALL LUCK

AUDCAD - Bulls Steppin in!Hello TradingView Family / Fellow Traders. This is Richard, also known as theSignalyst.
📈AUDCAD has been overall bullish trading within the rising wedge pattern marked in blue.
Today, AUDCAD is retesting the lower bound of the wedge.
Moreover, it is approaching its previous weekly low.
🏹 Thus, the highlighted blue circle is a strong area to look for buy setups as it is the intersection of weekly low and lower blue trendline acting as a non-horizontal support.
📚 As per my trading style:
As #AUDCAD approaches the blue circle zone, I will be looking for bullish reversal setups (like a double bottom pattern, trendline break , and so on...)
📚 Always follow your trading plan regarding entry, risk management, and trade management.
Good luck!
All Strategies Are Good; If Managed Properly!
~Rich
Disclosure: I am part of Trade Nation's Influencer program and receive a monthly fee for using their TradingView charts in my analysis.
AUD-CAD Local Long! Buy!
Hello,Traders!
AUD-CAD went down sharply
And the pair has hit a horizontal
Support of 0.9011 from
Where we are already seeing
A bullish reaction so we
Are locally bullish biased
And we think that the price
Will go up in a bullish correction
Buy!
Comment and subscribe to help us grow!
Check out other forecasts below too!
Disclosure: I am part of Trade Nation's Influencer program and receive a monthly fee for using their TradingView charts in my analysis.

AUDCAD: Long Signal Explained
AUDCAD
- Classic bullish formation
- Our team expects pullback
SUGGESTED TRADE:
Swing Trade
Long AUDCAD
Entry - 0.9024
Sl - 0.8994
Tp - 0.9076
Our Risk - 1%
Start protection of your profits from lower levels
Disclosure: I am part of Trade Nation's Influencer program and receive a monthly fee for using their TradingView charts in my analysis.
❤️ Please, support our work with like & comment! ❤️

AUDCAD On The Rise! BUY!
My dear subscribers,
AUDCAD looks like it will make a good move, and here are the details:
The market is trading on 0.9063 pivot level.
Bias - Bullish
Technical Indicators: Both Super Trend & Pivot HL indicate a highly probable Bullish continuation.
Target - 0.9088
About Used Indicators:
The average true range (ATR) plays an important role in 'Supertrend' as the indicator uses ATR to calculate its value. The ATR indicator signals the degree of price volatility.
———————————
WISH YOU ALL LUCK

AUDCAD BUYAUDCAD may flip bullish in this bullish flag scenario. It looks as though the bullish flag has formed and retested. I would like to see price touch 0,9065 before the rally. Targeting 0,91444

AUDCAD Dropping to Monthly LowLooking at the Price Action on AudCad this week we can see that market structure is aligning with fundamentals where Cad is leading in bullish data fundamentally, now looking at the structure POV a nice H&S pattern is forming at the mid level 0.91250 and giving us a Break of previous Demand Zone and a Lower High Break of Structure + after all of that price created a New Supply Zone. I do believe price will Drop to the monthly low and take out all the Higher Lows it created during this month with all this strong data that is being released, i at least expect a retest of the mayor level 0.90000

AUDCAD Approaching Key Resistance — Potential Sell SetupOANDA:AUDCAD is approaching a key resistance zone, highlighted by strong selling interest. This area has historically acted as a supply zone, increasing the likelihood of a bearish reversal if sellers step in.
The current market structure suggests that if the price confirms resistance within this zone, we could see further downside movement. A successful rejection could push the pair toward 0.90700, a logical target based on prior price behavior and the current structure.
However, if the price breaks and holds above this resistance, the bearish outlook may be invalidated, potentially leading to further upside.
Just my take on support and resistance zones—not financial advice. Always confirm your setups and trade with solid risk management.
Best of luck!

AUD/CAD Breakout in Motion – Bulls Targeting Higher LevelsTechnical Overview:
The AUD/CAD pair has formed a clear ascending triangle pattern, signaling bullish momentum.
A successful breakout above the resistance zone indicates potential upward movement toward key levels.
Price is currently testing a resistance level near 0.9093, and a clean break above could trigger a strong rally.
Key Levels to Watch:
Entry Zone: Above 0.9093 (breakout confirmation)
First Target (TP1): 0.9163
Second Target (TP2): 0.9299
Stop Loss (SL): Below 0.9008 (previous structure support)
Supporting Factors for Bullish Bias:
✅ Trendline Support: The ascending trendline is holding strong, reinforcing bullish structure.
✅ Higher Lows Formation: Indicates buyers are stepping in aggressively.
✅ Breakout Confirmation: If price sustains above 0.9093, momentum will likely continue.
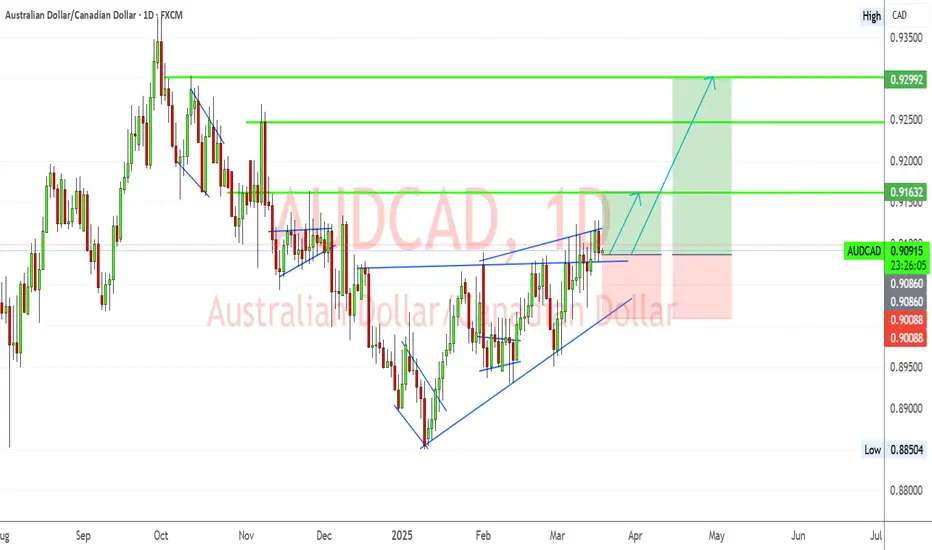

AUDCAD Eyeing 0.9300 On The Daily ChartAUDCAD Eyeing 0.9300 On The Daily Chart
Since late January 2025, AUDCAD has been steadily accumulating volume, leading to the clear formation of a bullish triangle pattern.
Despite the Australian dollar's overall weakness, breaking through the critical resistance level at 0.9085 within this daily pattern has significantly increased the likelihood of further upward movement in the coming days.
Key Resistance Levels:
0.9175
0.9260
0.9300
You may watch the analysis for further details!
Thank you:)
❤️PS: Please support with a like or comment if you find this analysis useful for your trading day❤️
Disclosure: I am part of Trade Nation's Influencer program and receive a monthly fee for using their TradingView charts in my analysis.
