AUD/CAD Analysis: Elliott Wave and Fibonacci ProjectionsElliott Wave Structure:
The price appears to be completing a 5-wave corrective structure, with wave (5) targeting the 1.618 extension of the previous wave (approximately 0.8769).
This indicates a continuation of the bearish trend until wave (5) concludes.
Fibonacci Levels:
Key retracement zones between 0.9043 (61.8%), 0.9014 (50%), and 0.8985 (38.2%) have acted as resistance, reinforcing the bearish momentum.
The Fibonacci extensions of wave (3) provide a clear projection for the next leg lower.
Bearish Momentum:
A descending trendline from previous highs and lower highs reflects strong seller dominance.
Price action remains below the Ichimoku cloud, confirming bearish sentiment.
Key Levels to Watch:
Immediate Resistance: 0.9043 (61.8% Fibonacci retracement).
Projected Support: 0.8769 (1.618 Fibonacci extension of wave (5)).
Conclusion:
AUD/CAD is likely to continue its bearish trajectory, targeting the 0.8769 zone as wave (5) completes. Traders should monitor the key Fibonacci and Elliott Wave levels for potential reversal signals.
📢 Disclaimer:
This analysis is for informational purposes only and does not constitute financial advice. Always conduct your own research before making trading decisions. 🛑
AUDCAD trade ideas

AUDCAD Potenial DownsidesHey Traders, in this week we are monitoring AUDCAD for a selling opportunity around 0.89700 zone, AUDCAD is trading in a downtrend and currently is in a correction phase in which it is approaching the trend at 0.89700 support and resistance area.
Trade safe, Joe.

AUD/CAD "Aussie-Canadian" Forex Market Bullish Heist Plan🌟Hi! Hola! Ola! Bonjour! Hallo!🌟
Dear Money Makers & Robbers, 🤑 💰
Based on 🔥Thief Trading style technical and fundamental analysis🔥, here is our master plan to heist the AUD/CAD "Aussie-Canadian" Forex market. Please adhere to the strategy I've outlined in the chart, which emphasizes long entry. Our aim is the high-risk Red Zone. Risky level, overbought market, consolidation, trend reversal, trap at the level where traders and bearish robbers are stronger. 👀 So Be Careful, wealthy and safe trade.💪🏆🎉
Entry 📈 : You can enter a Bull trade at any point,
however I advise placing Buy limit orders within a 15 or 30 minute timeframe. Entry from the most recent or closest low or high level should be in retest.
Stop Loss 🛑: Using the 2H period, the recent / nearest low or high level.
Goal 🎯: 0.90800
Scalpers, take note : only scalp on the Long side. If you have a lot of money, you can go straight away; if not, you can join swing traders and carry out the robbery plan. Use trailing SL to safeguard your money 💰.
Fundamental Outlook 📰
Considering these factors, the AUD/CAD pair may experience a bullish trend in the short-term, driven by:
Australia's relatively stronger economy.
Canada's potential rate cuts in 2025.
Weakening Canadian dollar due to decreased energy exports.
However, this outlook is subject to change based on new economic data releases and shifts in global market sentiment.
Warning⚠️ : Our heist strategy is incompatible with Fundamental Analysis news 📰 🗞️. We'll wreck our plan by smashing the Stop Loss 🚫🚏. Avoid entering the market right after the news release.
Take advantage of the target and get away 🎯 Swing Traders Please reserve the half amount of money and watch for the next dynamic level or order block breakout. Once it is resolved, we can go on to the next new target in our heist plan.
💖Supporting our robbery plan will enable us to effortlessly make and steal money 💰💵 Tell your friends, Colleagues and family to follow, like, and share. Boost the strength of our robbery team. Every day in this market make money with ease by using the Thief Trading Style.🏆💪🤝❤️🎉🚀
I'll see you soon with another heist plan, so stay tuned 🫂

AUDCAD Wave Analysis 30 December 2024
- AUDCAD reversed from resistance level 0.8980
- Likely to fall to support level 0.8900
AUDCAD currency pair recently reversed down from the key resistance level 0.8980 (former support from the start of December) intersecting with the 38.2% Fibonacci correction of the downward impulse from last month.
The downward reversal from the resistance level 0.8980 continues the active short-term impulse wave c of the ABC correction 2 from the end of September.
AUDCAD currency pair can be expected to fall to the next support level 0.8900 (former support from August and the target price for the completion of the active wave 2).


AUDCAD BEARISH MOVE SEENThis instrument has been trending downwards, bears are still strong, lets observe or trade the retracement, as we set up for the big move down..... Analyse your entries and exits in H4 and refine in H1..... Lets go... Thank you.

AUDCAD: Expecting Bullish Continuation! Here is Why:
The price of AUDCAD will most likely increase soon enough, due to the demand beginning to exceed supply which we can see by looking at the chart of the pair.
❤️ Please, support our work with like & comment! ❤️

AUDCAD Reversal in SightThe downtrend is losing strength against the bottom green descending trendline.
I expect a reversal to the upside soon, targeting the levels shown in the chart.
My primary wave count considers this to be the end of several "ABCs"

AUDCAD TREND BULLISH SUPPORT BY FUNDAMENTALS Week 52Still shorting AUDCAD until structure flipped.
Seeing a descending channel. That suggest we are done bearish

AUDCAD Potential DownsidesHey Traders, in today's trading session we are monitoring AUDCAD for a selling opportunity around 0.89750 zone, AUDCAD is trading in a downtrend and currently is in a correction phase in which it is approaching the trend at 0.89750 support and resistance area.
Trade safe, Joe.

Lingrid | AUDCAD divergence at the DEMAND zoneThe price perfectly fulfilled my last idea. It hit the target. FX:AUDCAD recently made a bearish move by breaking out of the consolidation zone. The price has now reached a demand zone where it previously surged. Additionally, the price action has formed a descending channel along with a bullish divergence, indicating that the bears are losing momentum. On the daily timeframe, the market also showed a fake breakout at this level, highlighting its significance. I expect the market to bounce off the support level and retest the psychological level above. My goal is resistance zone around 0.9000
Traders, if you liked this idea or if you have your own opinion about it, write in the comments. I will be glad 👩💻

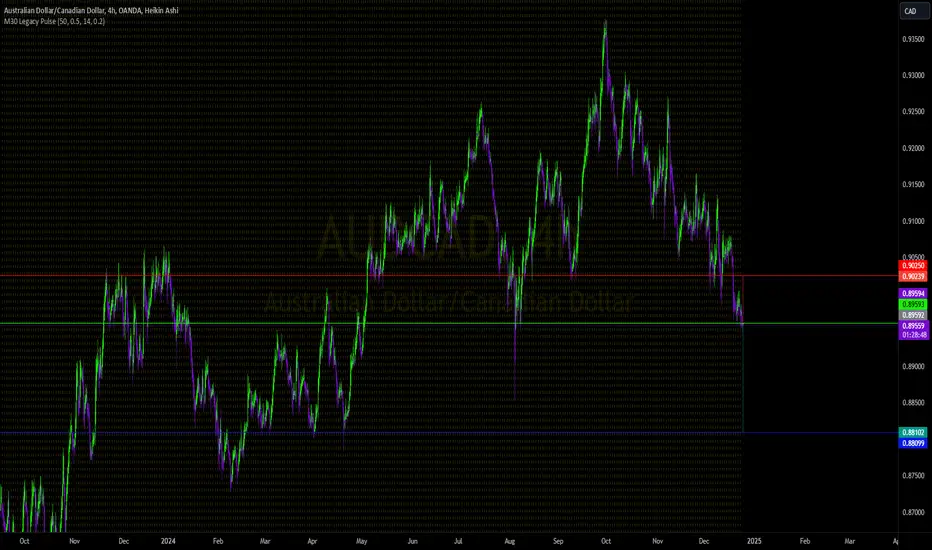
AUDCAD📉🔍 **AUDCAD Short Setup Update – Trust the Process!** 💼✨
Hey T.Y.L.A. family! 🌟
Here’s the latest on our **AUDCAD short setup**—it’s game time! Let’s break it down:
🔹 **Coordinates for Success**:
- **Entry**: **0.89593**
- **Stop Loss (SL)**: **0.90250**
- **Take Profit (TP)**: **0.88099**
- **Trailing Stop (TS)**: **30 pips**
🔹 **Why This Setup?**: The market is aligning perfectly with our strategy, giving us a high-probability opportunity while maintaining controlled risk.
🔹 **Risk-Managed Confidence**: This trade is another reminder that we stick to what works—tight stops, clear targets, and no emotional decisions.
🔹 **Steady Growth, Always**: Our focus is on consistent monthly returns of **25%**. No shortcuts, just discipline and proven methods.
📊 **Reminder for the Team**: Markets can be unpredictable, but that’s why we have a system. The trailing stop protects our gains as the trade moves in our favor, so you can rest assured that we’re managing risk every step of the way.
🔥 **Your Mindset Matters**: Doubt and hesitation have no place here. Take a deep breath, stick to the plan, and remember—you’re not doing this alone.
Let’s crush it together! Drop a 📈 if you’re in on this trade or have questions. As always, we’re here to tackle limits and grow stronger, one trade at a time.
#TackleYourLimits #TYLA #ConfidenceInConsistency
AUDCAD: Bulls Will Push Higher
Balance of buyers and sellers on the AUDCAD pair, that is best felt when all the timeframes are analyzed properly is shifting in favor of the buyers, therefore is it only natural that we go long on the pair.
❤️ Please, support our work with like & comment! ❤️

SHORT ON THE AUD/USD?im waiting for a shorting opportunity here on the AUD/CAD because of the trendline breakout and it respected the major downward trendline which i believe its still valid, the momentum is good we shall see.

AUDCAD SELLING OPPORTUNITY.1D TF broke structure to the downside . my bias is bearish now . looking for price to retrace to my entry point.

AUDCAD-BULLISH IDEAAUDCAD seems to be changing its trend into bullish as it has retraced from HH to HL at 0.786and made a bullish divergence,characteristically showing same pattren as it can be seen in chart.

AUD/CADMonitor this pair and watch 0.89600 area. there is a great chance that it bounce back up to 0.89900 area.
In 1H time frame, it made a nice double top and it continues Bearish move. However, Buyers will come to play around0.89600 as previously they have come.
Obviously, that is my expectation. if at lower time frame, show the sign of Bullish move, then i will take that.
Let's see how it performs.

AUDCAD - Look for a short !!Hello traders!
‼️ This is my perspective on AUDCAD.
Technical analysis: Here we are in a bearish market structure from 4H timeframe perspective, so I look for a short. I expect price to continue the retracement to fulfill the imbalance and then to reject from bearish OB.
Like, comment and subscribe to be in touch with my content!

AUDCAD: Bullish Harmonic Pattern and Risky Counter Trend TradeAUDCAD: Bullish Harmonic Pattern and Risky Counter Trend Trade
AUDCAD has completed a bullish harmonic pattern near 0.8955. The price reaction so far looks promising, and the chances for a larger bullish wave are increasing after a prolonged bearish trend. However, it is still early and risky, as the overall trend remains downward, but our targets are not too far away.
Additionally, the RBA was not particularly dovish during the recent RBA interest rate decision, which could be another reason for AUDCAD to show some bullish momentum before the end of the year.
You can find more details in the chart!
Thank you!

AUDCAD FORECASTTraders we are approaching Christmas day! On these days we normally find that the market is having unusual volatility, most of the times is low volatility and volume in the market. We need to make sure that we are aware of this so that we become carefully when it comes to making decision in the market!


AUD_CAD RISKY SHORT|
✅AUD_CA D is trading in a
Downtrend and the pair is
Already pulling back from
The horizontal resistance
Level of 0.9010 so we are
Bearish biased and we will
Be expecting a further
Bearish move down
SHORT🔥
✅Like and subscribe to never miss a new idea!✅

AUDCAD TREND BULLISH SUPPORT BY FUNDAMENTALSI am bullish on AUDCAD as recent economic data supports a stronger Australian dollar. Australia’s economy benefits from rising commodity prices and resilient economic performance, while the Canadian dollar faces headwinds from softening oil prices and weaker economic growth. Technically, AUDCAD is showing bullish momentum, with higher highs and lows forming on the daily chart. These factors combined point to further upside potential for the pair.
I don't mind shorting at supply zones downwards too.
Will keep shorting till structure breaks
