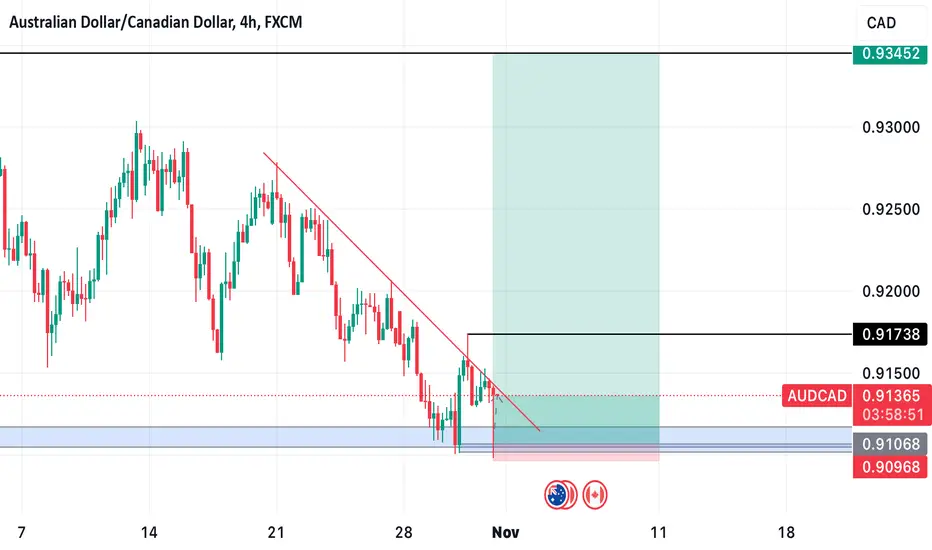
AUDCAD in support area. Are we ready for reverse?Hi traders, AUDCAD is in support from its temporal bearish movement.
Although the primary trend is bearish, we might see reverse movement from AUDCAD.
In small timeframe, we already see AO indicator in positive area and we might see reverse in short term.
Good luck!
AUDCAD trade ideas

AUDCADAUDCAD has been on a down trend and I'm anticipating one last push the down side for price to fill in that inefficiency on that demand level.

AUDCAD sellAUDCAD has been selling ,and I'm anticipating one last push to the downside to fill in that inefficient price at that demand level highlited.

Audcad for buy.Audcad is bullish on the higher timeframe. Wait for breakout and retest of the lower timeframe bearish trendline to breakout and retest the support zone.

AUDCAD SHORTMonthly
Overall sentiment Bullish, I'm expecting price to continue lows having come of a tweezer top candle formation last month with price failing to close above this resistance level at 0.9375 for 2 years now with almost identical PA coming of those very highs. we have EMA support which if breached will be further confluence for big move to the downside.
Weekly
Overall sentiment Bullish, although looking at PA in the bigger picture it seems bullish with price closing below my AOI and dynamic ema resistance I feel there is a chance we can get a ema crossover if PA continues bearish for the early part of next week with aims to fill out previous weekly candles wick. On the other hand any significant change of character or bullish formations or closes above 0.9200 key level and just above previous weekly highs would be a signal of a reversal.
Daily
Overall bearish PA producing LH & LL, I like this daily chart as PA is ver simplified along with LL/LH we have price consistently rejecting AOI at 0.9170 this area is now acting as a resistance whereas it was previously support for the month of October, further confluence is 50 Ema dynamic resistance and weekly fib 0.618 level holding.
4hr + Entry
Overall bearish with somewhat clean PA to the downside, outlooks similar to daily with ema, fib and PA confluences ill await 4hr bearish close somewhere below 0.9160 to execute shorts
This was the analysis I mentioned in previous video where I stated I believe I may prefer this over FX:AUDCHF Shorts
If you find this analysis helpful or even if you oppose it pls like or comment would be good to hear your feedback! ;)
All Technical analysis is for journaling purposes.

AUD/CAD Analysis (4H Timeframe)🚀 **AUD/CAD Analysis (4H Timeframe): Targeting 0.93000!** 📈
AUD/CAD is currently at **0.91616** on the 4-hour chart, with a target set at **0.93000**. This pair is approaching key levels that could support a bullish move toward our target in the near term.
🔍 **Key Levels to Watch:**
- **Current Price:** 0.91616
- **Key Resistance:** 0.92211
- **Key Support:** 0.91070, 0.90378
- **Target Price:** 0.93000
💡 **Our Strategy:** A strong move above 0.92211 may signal the beginning of a bullish push toward 0.93000. We’re monitoring these levels closely for confirmation.
👉 What are your thoughts on AUD/CAD’s next move? Let us know if you’re bullish too!
#AUDCAD #ForexAnalysis #PricePrediction #KeyLevels #Pipnest

AUD_CAD SHORT FROM RESISTANCE|SHORT|
✅AUD_CAD went up sharply
But a strong resistance level was hit at 0.9178
Thus I am expecting a pullback
And a move down towards the target at 0.9120
SHORT🔥
✅Like and subscribe to never miss a new idea!✅

AUD-CAD Move Down Ahead! Sell!
Hello,Traders!
AUD-CAD is about to retest
A horizontal resistance
Of 0.9200 from where we
Will be expecting a
Further move down
Sell!
Like, comment and subscribe to help us grow!
Check out other forecasts below too!

Audcad.... BearishAs you can see price is in a clear down trend. Previous support is now resistance. I'm in for shorts . 0.9021 is my target area. Stops is pretty tight here. I believe price is ready to move. I think entries here are perfect.

AUDCAD Is Very Bearish! Short!
Please, check our technical outlook for AUDCAD.
Time Frame: 3h
Current Trend: Bearish
Sentiment: Overbought (based on 7-period RSI)
Forecast: Bearish
The market is on a crucial zone of supply 0.914.
The above-mentioned technicals clearly indicate the dominance of sellers on the market. I recommend shorting the instrument, aiming at 0.910 level.
P.S
Overbought describes a period of time where there has been a significant and consistent upward move in price over a period of time without much pullback.
Like and subscribe and comment my ideas if you enjoy them!

audcad bearishAudcad had formed a triangle formation above its uptrend. It broke it and tested it several times. From here it will pull back to the lower trend support.

AUDCAD: Bearish Move From Resistance 🇦🇺🇨🇦
AUDCAD may retrace from the underlined solid resistance.
As a confirmation, I see an inverted cup & handle pattern on an hourly.
Goals: 0.9123 / 0.9107
❤️Please, support my work with like, thank you!❤️

AUDCAD BUY SETUP!!“Most traders take a good system and destroy it by trying to make it into a perfect system.” - Robert Prechter

AUDCAD BUY STOPAUDCAD is making lower Highs and lower Lows, it is in down trend but now it formed RSI divergence. it will likely to change its up trend into up trend so place the buy stop order above LH

BUY AUDCADAn imbalanced just filled up
Break of structure on the LTF
I started buying on thr retest
Now I’m looking to buy more after the bigger TF break of structure
AudCad Trade UpdateAnother set up I posted were AC shorts! Price ended up respecting the higher time frame lower low and ended up flipping structures after the pullback to confirm the bearish trend. Your targets should've been hit if you took the trade. A 1:3rr could've been secured on the trade!

AUDCAD Week 2Hello guys - Peace be upon you.
We got some mixed Bias on the AUDCAD. However we got some clearly sight on the Daily Bias. so we can expect another Bullish sweep Before it is going down.
Hope you like it :-)


AUDCAD broke downward channelAUDCAD on one hour chart has broken downward channel, rsi shows bullish divergence price has printed higher high currently price has taken a correction good opportunity for buying at current levels.

AUDCAD BULLISH MOMENTUM | 1H ANALYSIS aud/cad looks good in the upcoming market ' its a multi time frame analysis
entries and exit levels were marked on the chart in result of 1:10 risks to reward ratio

AUD_CAD BEARISH BIAS|SHORT|
✅AUD_CAD went down and
Broke the key horizontal
Level of 0.9180 and the
Breakout is confirmed
So we are bearish biased
And we will be expecting
A further move down
SHORT🔥
✅Like and subscribe to never miss a new idea!✅

AUDCAD SELL OFF?AUD/CAD refers to the currency pair that represents the value of the Australian dollar (AUD) against the Canadian dollar (CAD). Traders and investors often analyze this pair to make decisions based on economic indicators, interest rates, and geopolitical factors affecting Australia and Canada

AUDCAD Will Keep Falling!OANDA:AUDCAD AUDCAD is falling down
After the bearish breakout
Of the key horizontal level
Of 0.91695 which is now a
Resistance and we will be
Expecting a bearish continuation !
