AUD/CAD BUYERS WILL DOMINATE THE MARKET|LONG
Hello, Friends!
AUD/CAD pair is in the uptrend because previous week’s candle is green, while the price is obviously falling on the 1H timeframe. And after the retest of the support line below I believe we will see a move up towards the target above at 0.870 because the pair is oversold due to its proximity to the lower BB band and a bullish correction is likely.
Disclosure: I am part of Trade Nation's Influencer program and receive a monthly fee for using their TradingView charts in my analysis.
✅LIKE AND COMMENT MY IDEAS✅
AUDCAX trade ideas
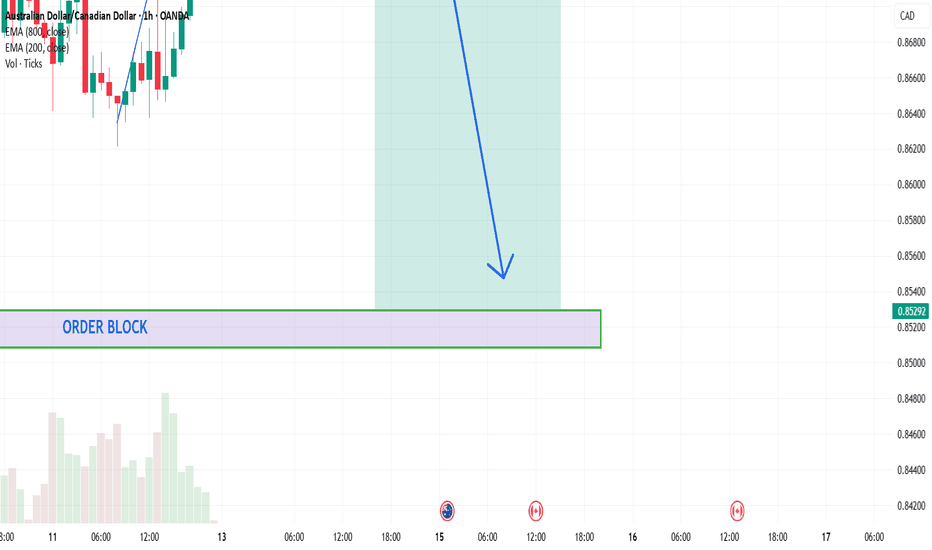
AUDCAD SHORTAUDCAD is expected to go short after completing the current bullish run.
price is expected to reach the bearish orderblock at around 0.91054 and then start a bearish run all the way down to the bullish orderblock at around 0.85295.
NOTE: This is just my analysis, conduct your own analysis before PLACING the trade.
please use proper risk management .
AUDCAD — Breakout coming, or will price keep pushing on?AUDCAD is currently testing a key level. Watching closely to see if price breaks out or continues within the current range. A breakout could open up new trading opportunities, while rejection might signal further consolidation or a move back within structure. Keeping an eye on price action for confirmation.
AUDCAD – Bullish Trade Setup (short term)✅ Key Observations:
Timeframe: 1 Hour
Signal: Bullish Divergence on RSI
Trend Context: Likely in a pullback or accumulation phase within a higher timeframe structure
🔍 Technical Confluences:
RSI Divergence: Price made a lower low while RSI made a higher low – classic bullish divergence
Potential Support Zone: Price likely bouncing from a demand zone
Volume (if visible): Look for declining sell volume or spike in buy volume
📈 Trade Plan – LONG Position
Entry:
On confirmation candle (first strong bullish candle after divergence)
OR break of minor resistance/trendline above divergence pattern
Stop-Loss:
Below the recent swing low (beneath divergence point)
Take-Profit Targets:
TP1: Previous high / structure resistance
TP2: Extension of the move, possibly around 1.27 or 1.618 Fibonacci extension from the swing low
Risk-Reward Ratio: Minimum 1:2
⚠️ Risk Notes:
If price fails to break structure or gets rejected at a minor resistance – re-evaluate
Best to enter when divergence aligns with a support zone or trendline
AUD/CAD Bearish Rejection Setup – Short Opportunity from Key ResEMA 200 (blue line): 0.86328 – long-term trend indicator.
EMA 30 (red line): 0.86473 – shorter-term momentum.
Price is currently trading below the EMA 200, and approaching the resistance zone, hinting at a possible short opportunity.
🟪 Key Levels Highlighted:
Entry Point: Around 0.87240, near the upper boundary of the resistance zone.
Stop Loss: Just above resistance at 0.87758.
Target Point (EA TARGET POINT): At the demand/support zone of 0.84734.
📉 Bearish Setup Summary:
Risk/Reward Ratio: High – the chart targets a ~2.78% downside move (~242 pips), suggesting a favorable setup.
Bearish Structure:
Strong prior downtrend leading into a potential lower high formation.
Price is reacting to a known supply zone.
A possible double top or resistance rejection pattern forming.
🧠 Confluences Supporting the Trade:
EMA alignment – price below the 200 EMA.
Bearish reaction at supply zone.
Clean drop zone – minimal structure between entry and target area.
Bearish rejection pattern potentially forming.
⚠️ Watch Out For:
Break and hold above 0.8775 would invalidate the setup.
Fundamental catalysts (especially AUD or CAD-related news) may add volatility.
A strong bearish rejection candle around the entry zone would increase confidence in the short position.
AUDCAD may rise from support zone after tariff newsAUDCAD may rise from support zone after tariff news
AUDCAD chart suggests a potential upward trend from the support zone toward the defined targets as shown on the chart.
AUDCAD could rise in the short-term, taking advantage of China's comments on tariffs.
Support zone is Identified around 0.84539, signaling a potential rebound area.
Current Price is reflecting a slight bullish momentum.
First target at 0.8600, second target at 0.8665, indicating potential bullish momentum.
You may find more details in the chart!
Thank you and Good Luck!
❤️PS: Please support with a like or comment if you find this analysis useful for your trading day❤️
Disclosure: I am part of Trade Nation's Influencer program and receive a monthly fee for using their TradingView charts in my analysis.
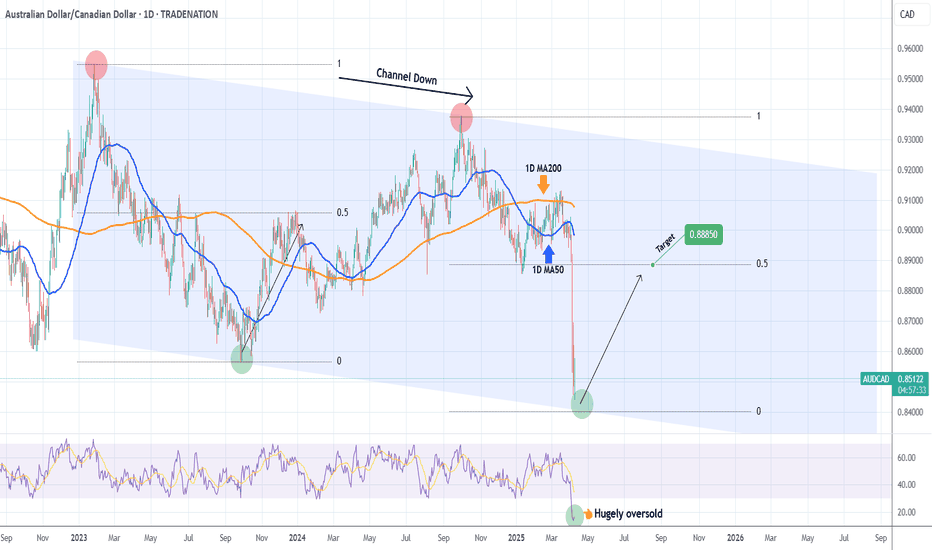
AUDCAD Excellent Channel Down bottom opportunity.The AUDCAD pair has been trading within a long-term Channel Down since the January 26 2023 High and the recent Trade War fueled sell-off took the price almost on its bottom (Lower Lows trend-line).
The 1D RSI got vastly oversold at 14.00 and a bottom is to be expected within the next 2 weeks. Still, this level is low enough to be considered a solid long-term buy opportunity already. The previous bottom rebound targeted initially the 0.5 Fibonacci retracement level, so our target is 0.88850 on the medium-term.
-------------------------------------------------------------------------------
** Please LIKE 👍, FOLLOW ✅, SHARE 🙌 and COMMENT ✍ if you enjoy this idea! Also share your ideas and charts in the comments section below! This is best way to keep it relevant, support us, keep the content here free and allow the idea to reach as many people as possible. **
-------------------------------------------------------------------------------
Disclosure: I am part of Trade Nation's Influencer program and receive a monthly fee for using their TradingView charts in my analysis.
💸💸💸💸💸💸
👇 👇 👇 👇 👇 👇
AUDCAD…When is enough, enough?!Good day traders, we back with another beautiful idea on AUDCAD but here we not focusing on buying and selling but rather to test a study I’m currently busy with, well in a nutshell I’m studying inside day candle stick pattern, currently on the 4hour TF we have a big bearish candle followed by a lot of small bullish candle sticks but all that trading is happening inside that one big 4 hour candle.
How I like to interpret this pattern in my years of back testing this pattern(still am)😂 inside day candles can be used as both a continuation or a reversal pattern but but depending on the market structure!! What price is doing currently on the 1hr TF I like to explain it to my friends as a beautiful lady who only wants your money 😂😂 because price is making traders believe that the reversal has started but truth is price is still gonna move lower the the liquidity resting below before moving higher to reverse the big move we saw last week and beginning of this current week.
We can expect price to take to low of Monday than shift structure higher to confirm our bias that price will reverse. Remember we study price and time not technical analysis.
Swing USDCHF trade idea 08/04/2025AUDCAD Analysis
AUDCAD has tapped and rejected its 3-quarter low of 0.85930, a level that’s held since April 2009. The 4H chart shows consolidation in a 50-pip range between 0.85930 and 0.85342.
We’re watching for a bullish 4H candle close above 0.85930 for safer entries. The safest confirmation comes above 0.87060, which would confirm a break of both a key level and bearish structure.
This setup has potential to evolve into a long-term swing with 700+ pips on the table if held. Trade patiently and wait for clean confirmations.
AUDCAD Buy Opportunity Based on EASY Trading AI SignalAUDCAD has just triggered a promising BUY signal from the EASY Trading AI model. Entering at 0.85218, our system projects growth towards the Take Profit target at 0.86586. The Stop Loss recommended by EASY Trading AI is set safely at 0.84197.This bullish scenario aligns with recent AUD strength due to stable commodities and improving economic data from Australia. Simultaneously, weakening oil prices are impacting CAD negatively, enhancing upward momentum for AUDCAD.Closely monitor price to ensure adherence to EASY Trading AI guidelines, capitalizing effectively on clear market signals presented.
AUDCAD: True Bullish Reversal?! 🇦🇺🇨🇦
AUDCAD formed a nice inverted head and shoulders pattern
after a test of a key historic support.
A bullish violation of its neckline with a strong bullish candle
provides a reliable confirmation.
I expect a correctional move at least to 0.8723
❤️Please, support my work with like, thank you!❤️
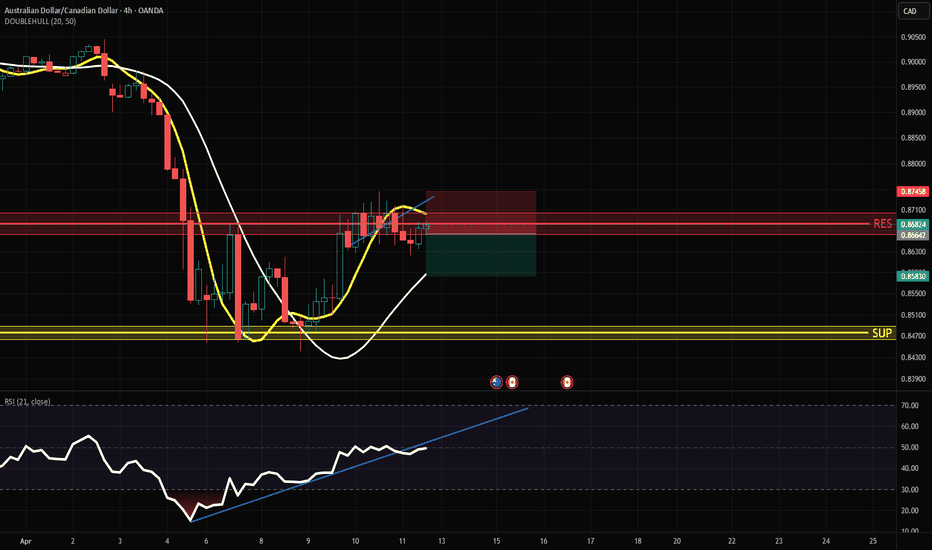
AUDCAD Discretionary Analysis: Next stop? Rock bottomIt’s more of a sixth sense (like when you just know your girlfriend's about to cancel plans). AUDCAD’s giving off that "Next stop? Rock bottom" kind of energy. I see it dropping hard, like it missed the elevator and took the shaft instead. If I’m right, I’ll be looking at some solid trades to take. If I’m wrong, well, I’ll just grab a coffee and wait for the next pair to make its move.
Just my opinion, not financial advice.


