AUDCAD The Target Is UP! BUY!
My dear subscribers,
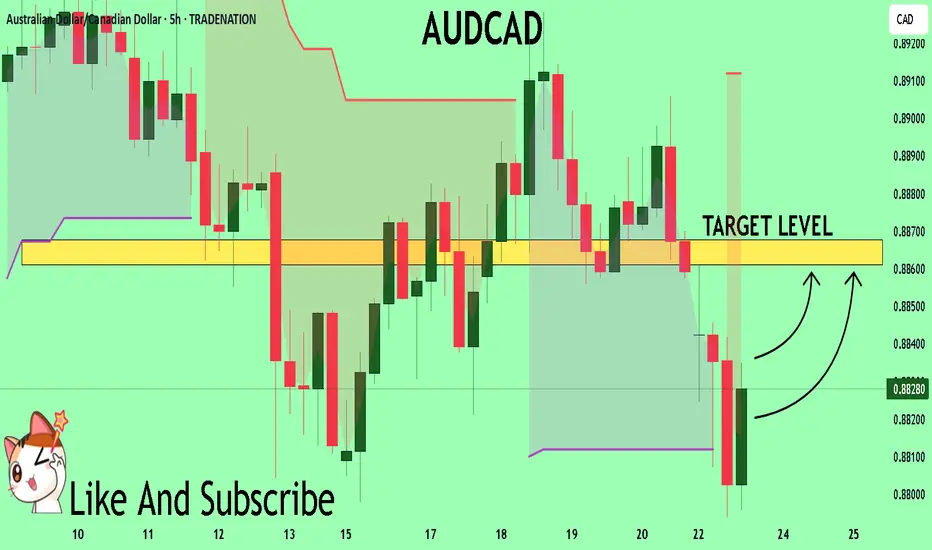
AUDCAD looks like it will make a good move, and here are the details:
The market is trading on 0.8830 pivot level.
Bias - Bullish
Technical Indicators: Both Super Trend & Pivot HL indicate a highly probable Bullish continuation.
Target - 0.8861
About Used Indicators:
The average true range (ATR) plays an important role in 'Supertrend' as the indicator uses ATR to calculate its value. The ATR indicator signals the degree of price volatility.
Disclosure: I am part of Trade Nation's Influencer program and receive a monthly fee for using their TradingView charts in my analysis.
———————————
WISH YOU ALL LUCK
AUDCAX trade ideas
AUDCAD Will Move Lower! Short!
Please, check our technical outlook for AUDCAD.
Time Frame: 9h
Current Trend: Bearish
Sentiment: Overbought (based on 7-period RSI)
Forecast: Bearish
The price is testing a key resistance 0.885.
Taking into consideration the current market trend & overbought RSI, chances will be high to see a bearish movement to the downside at least to 0.879 level.
P.S
The term oversold refers to a condition where an asset has traded lower in price and has the potential for a price bounce.
Overbought refers to market scenarios where the instrument is traded considerably higher than its fair value. Overvaluation is caused by market sentiments when there is positive news.
Disclosure: I am part of Trade Nation's Influencer program and receive a monthly fee for using their TradingView charts in my analysis.
Like and subscribe and comment my ideas if you enjoy them!

AUDCAD SELL projection AUDCAD Closer Look, We need to witness Some sell Pressure on AUDCAD from a Daily/4H timeframe look.
We have a support level at 0.88997 tested severally in recent times.
By Next week the 0.88997 Support will be broken to the downside. which will open AUDCAD to further Sell down to 0.87347 - 0.86665 Support Levels

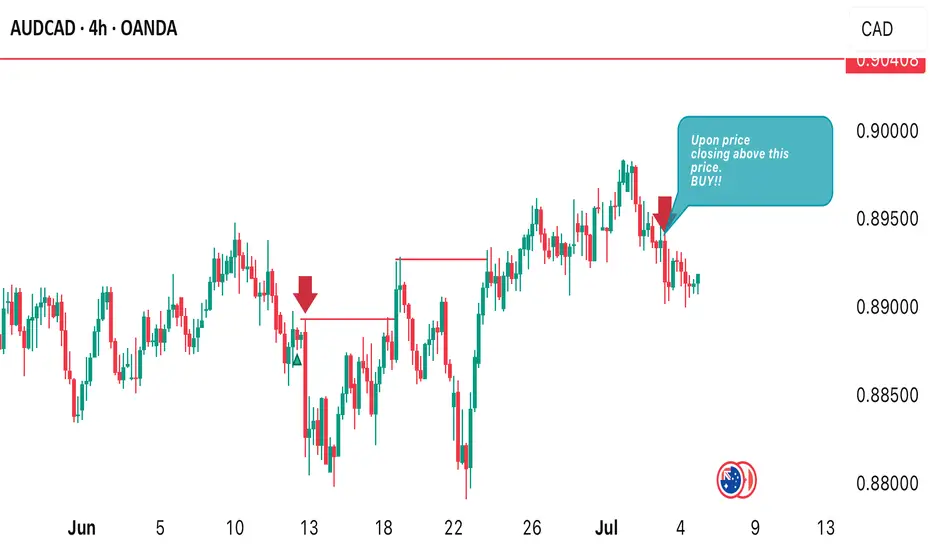
AUDCAD INTRADAY TIMEFRAME IS QUITE BULLISHPrice has completely shifted from intraday bearish to bullish. I anticipate more. Bullish price action to develop in later days of coming week. I am positioning myself for a buy opportunity. Once I see price close above 0.89413 I’m going long!
AUDCAD BUYBy utilizing Fibonacci retracement levels, historical patterns, , we can formulate a hypothesis that the market might follow a similar trajectory if bullish sentiment prevails.

AUDCADRejecting off the daily resistance zone and trendline. Waiting for break below H4/H1 support, retest then look for selling signals
AUD Cad Short waiting for the price to hit my area of resistance. pull back to entry point to confirm a bear trend .

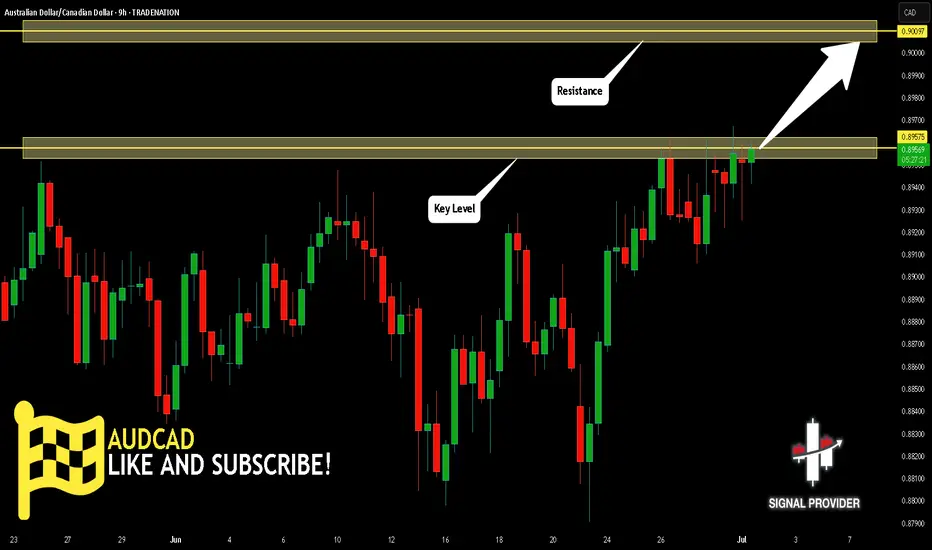
AUDCAD Is Going Up! Long!
Please, check our technical outlook for AUDCAD.
Time Frame: 9h
Current Trend: Bullish
Sentiment: Oversold (based on 7-period RSI)
Forecast: Bullish
The market is approaching a key horizontal level 0.895.
Considering the today's price action, probabilities will be high to see a movement to 0.900.
P.S
Please, note that an oversold/overbought condition can last for a long time, and therefore being oversold/overbought doesn't mean a price rally will come soon, or at all.
Disclosure: I am part of Trade Nation's Influencer program and receive a monthly fee for using their TradingView charts in my analysis.
Like and subscribe and comment my ideas if you enjoy them!
A bullish Trend in the AUDCAD pairI am taking my trade as chart showing clear divergence after bullish trend and pattern is sideways now but accepting to bearish.

AUDCAD Bulls update! Price is now approaching our first take profit (TP#1) at respected resistance level. I'm anticipating a small pullback from this area, followed by a potential continuation above the 0.89700 level.

AUD/CAD BEST PLACE TO BUY FROM|LONG
Hello, Friends!
AUD-CAD downtrend evident from the last 1W red candle makes longs trades more risky, but the current set-up targeting 0.886 area still presents a good opportunity for us to buy the pair because the support line is nearby and the BB lower band is close which indicates the oversold state of the AUD/CAD pair.
Disclosure: I am part of Trade Nation's Influencer program and receive a monthly fee for using their TradingView charts in my analysis.
✅LIKE AND COMMENT MY IDEAS✅

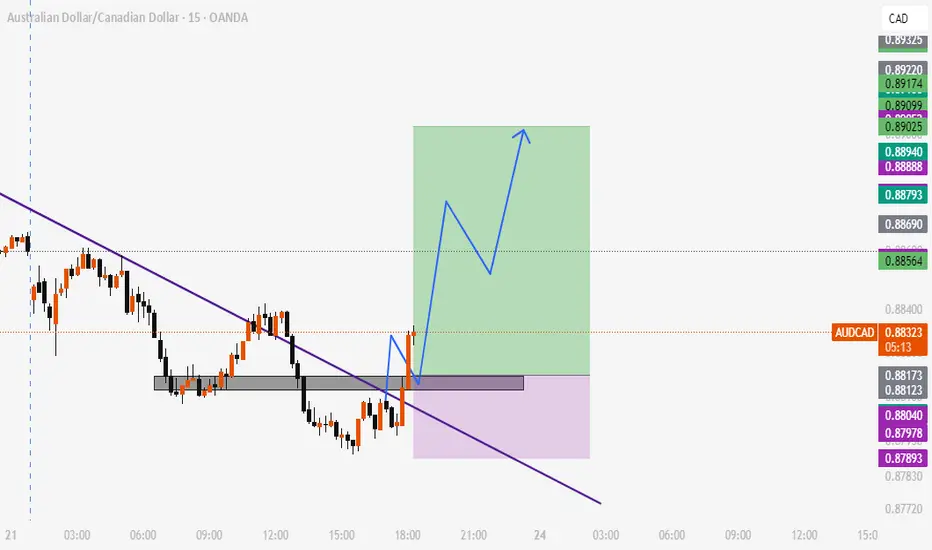
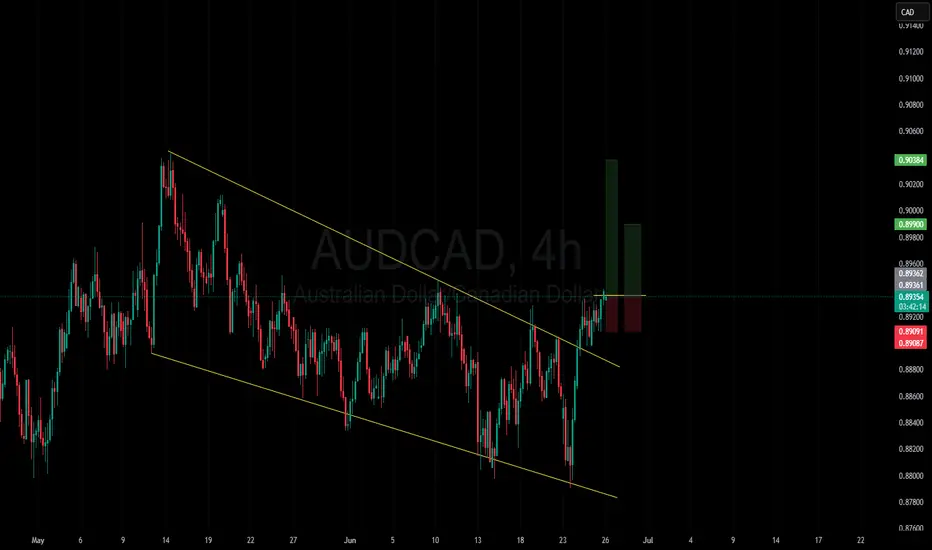
Expecting AUDCAD price increaseOn AUDCAD, the main bearish channel has been broken.
After the breakout of a micro channel as well, I’m expecting a potential bullish move to the upside.
Price action confirmation is aligned with this view.
There are two goals in this deal which is specified.
good luck
AudCad Trade IdeaAudCad is clearly ranging between 2 solid levels of support and resistance. We had clean bearish structures leading back into support where higher time frames then gave a bullish flip. I personally entered longs after the retest for a 1:3rr with targets just at the next level. We'll see how the set up plays out. All higher time frames are currently bullish as well.

AUDCAD: Long Signal with Entry/SL/TP
AUDCAD
- Classic bullish pattern
- Our team expects retracement
SUGGESTED TRADE:
Swing Trade
Buy AUDCAD
Entry - 0.8836
Stop -0.8817
Take - 0.8871
Our Risk - 1%
Start protection of your profits from lower levels
Disclosure: I am part of Trade Nation's Influencer program and receive a monthly fee for using their TradingView charts in my analysis.
❤️ Please, support our work with like & comment! ❤️


AUDCAD BEARISH SETUPThe 4-hour chart for AUD/CAD shows a well-respected bearish descending channel, where price action remains capped below a strong dynamic resistance. Price recently rejected a key resistance zone near 0.8900, signaling a potential continuation to the downside.
Key Observations:
Bearish Channel Intact: Price continues to respect the upper and lower bounds of the descending channel.
Key Resistance Rejection: The pair tested the 0.8900 resistance area and faced immediate rejection (highlighted in red), forming a lower high.
Break of Trendline: A rising trendline from the recent low has been broken, reinforcing bearish pressure.
Support Zone in Sight: If bearish momentum continues, the next major support lies around 0.8780 – 0.8800, offering a possible target area.
Short-term Setup: Minor upward retracement may retest the broken trendline, but unless 0.8900 is breached, the bias remains strongly bearish.
Conclusion:
AUD/CAD remains under bearish control within the descending channel. The recent rejection from the upper boundary and break of the rising trendline suggest a high-probability move toward the 0.8800 support zone. Traders should look for confirmation of lower highs or bearish engulfing patterns to position short.

AUDCAD SHORT FORECAST Q2 W25 D20 Y25AUDCAD SHORT FORECAST Q2 W25 D20 Y25
Professional Risk Managers👋
Welcome back to another FRGNT chart update📈
Diving into some Forex setups using predominantly higher time frame order blocks alongside intraday confirmation breaks of structure.
💡Here are some trade confluences📝
✅Weekly 50 EMA
✅Weekly order block rejection
✅Daily order block rejection
✅15’ order block identification
🔑 Remember, to participate in trading comes always with a degree of risk, therefore as professional risk managers it remains vital that we stick to our risk management plan as well as our trading strategies.
📈The rest, we leave to the balance of probabilities.
💡Fail to plan. Plan to fail.
🏆It has always been that simple.
❤️Good luck with your trading journey, I shall see you at the very top.
🎯Trade consistent, FRGNT X

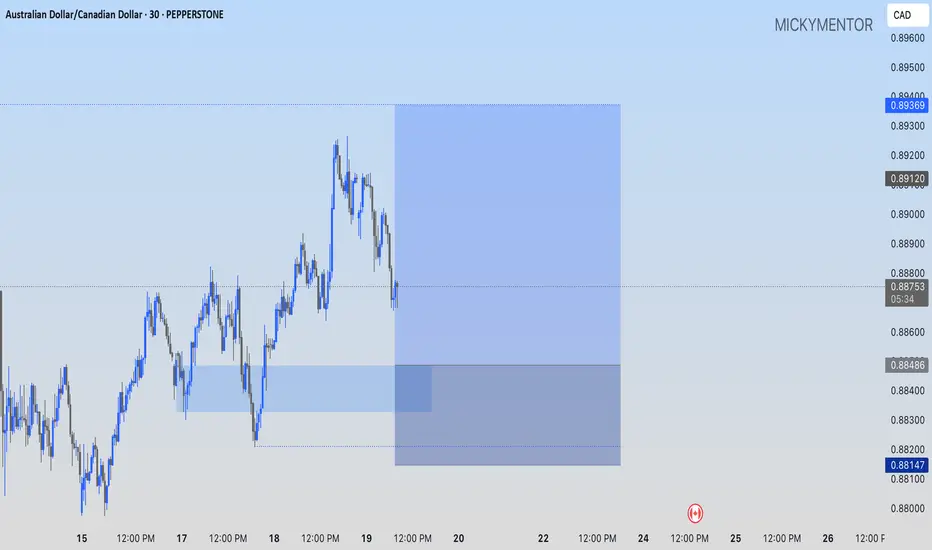
AUDCAD: A LONG TRADE OPPORTUNITY PEPPERSTONE:AUDCAD I'll be looking for buys from the 0.88486 price level.
AUDCAD Slips Overnight, Aussie Jobs Fall Short of ExpectationsAUDCAD Slips Overnight, Aussie Jobs Fall Short of Expectations
AUDCAD encountered firm resistance near the 0.8930 zone, triggering a sharp overnight drop of nearly 50 pips. This move followed softer-than-expected Australian employment data for May, where total jobs unexpectedly declined by 2,500—well below the forecast of a 22,500 increase. Despite the miss, the unemployment rate held steady at 4.1%, unchanged for over a year.
Following this initial drop, the pair may enter a short consolidation phase before resuming its bearish trajectory, as technical patterns suggest continued downside pressure.
🎯 Key downside targets: 0.8845, 0.8825, and 0.8805
You may find more details in the chart!
Thank you and Good Luck!
❤️PS: Please support with a like or comment if you find this analysis useful for your trading day❤️
Disclosure: I am part of Trade Nation's Influencer program and receive a monthly fee for using their TradingView charts in my analysis.

AUDCAD SHORT FORECAST Q2 W25 D19 Y25AUDCAD SHORT FORECAST Q2 W25 D19 Y25
Professional Risk Managers👋
Welcome back to another FRGNT chart update📈
Diving into some Forex setups using predominantly higher time frame order blocks alongside intraday confirmation breaks of structure.
💡Here are some trade confluences📝
✅Weekly 50 EMA
✅Weekly order block rejection
✅Daily order block rejection
✅15’ order block identification
🔑 Remember, to participate in trading comes always with a degree of risk, therefore as professional risk managers it remains vital that we stick to our risk management plan as well as our trading strategies.
📈The rest, we leave to the balance of probabilities.
💡Fail to plan. Plan to fail.
🏆It has always been that simple.
❤️Good luck with your trading journey, I shall see you at the very top.
🎯Trade consistent, FRGNT X

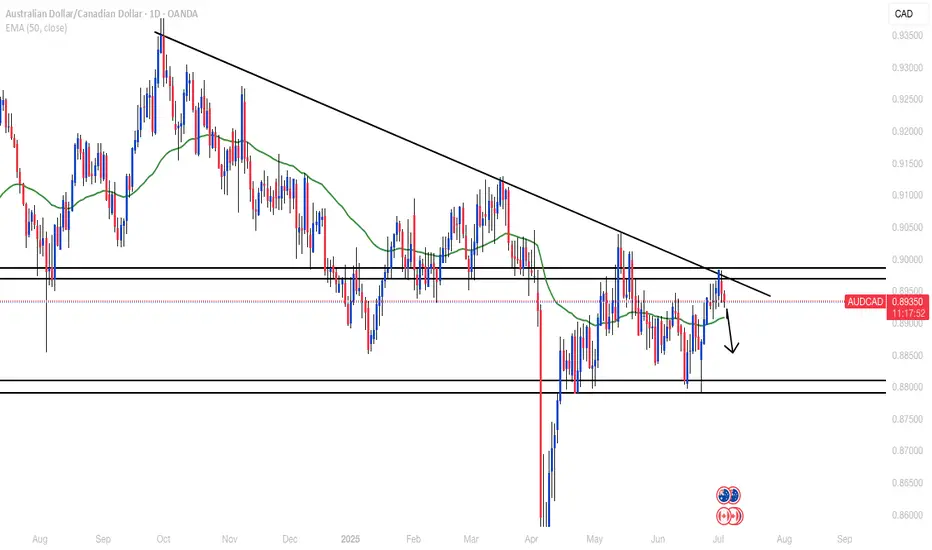
AUDCAD - OUTLOOKMy current view on AUDCAD. expecting CAD continue to strengthen in the coming weeks, and in-turn, expecting weak AUD in AUDCAD.
"May fortune attend thee, and thy trade prosper." .......L2Earned

AUDCAD SHORTThe sell is coming once the mkt reach the resistance consolidation band aera, and at that aera there is also monthly S/R/PP AERA THERE!!! And the BOLLINGER BAND will act as a "DYNAMIC RESISTANCE AERA TOO", so watch out for a "Price Action and Bearish Candlestick Revers Pattern" on the 1h/4h TF to go short/sell
