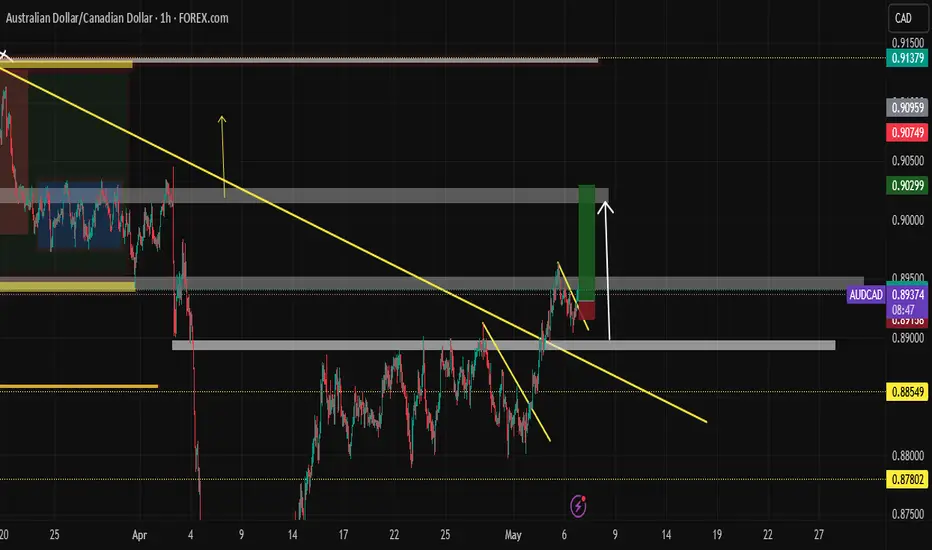
Sell zone at 0.89731Trading Journal Entry –
Trade Setup:
Currently watching a sell opportunity around the 0.89731 zone, with a strong buy level identified near 0.88170.
Rationale:
The 0.89731 level aligns with a notable resistance zone on the H4 and Daily charts, where price has previously encountered selling pressure. The recent bullish move appears to be testing this area again, and early signs of bullish exhaustion suggest a potential reversal. Price action near this zone has shown repeated rejection wicks and stalling momentum, which adds confluence for a short-term sell setup.
Meanwhile, the 0.88170 zone marks a major support level that has historically attracted strong buying interest. This level aligns with a prior accumulation area and could serve as a high-probability reversal point if price moves lower. The plan is to take profit from the short trade near this zone and look for a potential long setup, ideally supported by bullish confirmation on lower timeframes.
AUDCAX trade ideas

AUDCAD ... Top of The Week ... Potential Bullish MoveAUDCAD ... Top of The Week ... Potential Bullish Move
.
By: Noble.Mike.Jamison


AUDCAD | Sideways AUDCAD is not printing any new higher highs or lower lows.Instead it is moving in sideways.

AUD/CAD BEARS WILL DOMINATE THE MARKET|SHORT
Hello, Friends!
We are now examining the AUD/CAD pair and we can see that the pair is going up locally while also being in a uptrend on the 1W TF. But there is also a powerful signal from the BB upper band being nearby, indicating that the pair is overbought so we can go short from the resistance line above and a target at 0.887 level.
Disclosure: I am part of Trade Nation's Influencer program and receive a monthly fee for using their TradingView charts in my analysis.
✅LIKE AND COMMENT MY IDEAS✅

AUDCAD Will Go Lower! Short!
Take a look at our analysis for AUDCAD.
Time Frame: 1h
Current Trend: Bearish
Sentiment: Overbought (based on 7-period RSI)
Forecast: Bearish
The market is on a crucial zone of supply 0.890.
The above-mentioned technicals clearly indicate the dominance of sellers on the market. I recommend shorting the instrument, aiming at 0.888 level.
P.S
Please, note that an oversold/overbought condition can last for a long time, and therefore being oversold/overbought doesn't mean a price rally will come soon, or at all.
Disclosure: I am part of Trade Nation's Influencer program and receive a monthly fee for using their TradingView charts in my analysis.
Like and subscribe and comment my ideas if you enjoy them!

Sell AUDCADA beautiful scenario is at play here. First the bearish triangle pattern which price has already broken out of. Then, a triple top or head and shoulders pattern could also be at play. Then lastly, we can see price is moving in a downtrend within the channel drawn by a bearish flag pattern

audcadThe Relative Strength Index (RSI) is showing an upward trend, indicating increasing momentum. Additionally, the Moving Average Convergence Divergence (MACD) is showing a bullish crossover, further supporting the potential for an upward move.

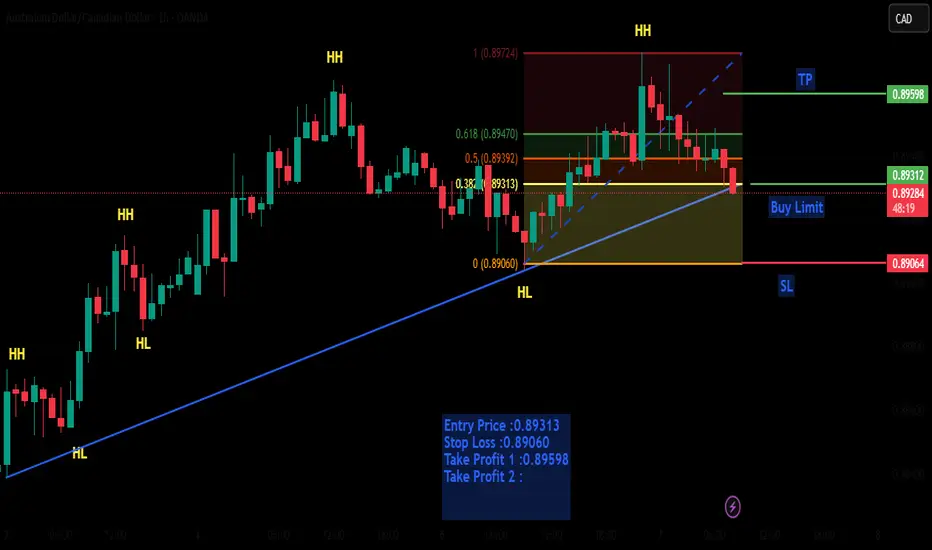
Current analysis on AUDCAD - BullishI am currently looking for buys on AUDCAD. Price previously created a higher Higher which then retraced back to our 61.80 percent level on our fibs. This AOI is also an exhaustion zone which increases the probability of our setup.
AUDCAD SHORT Market structure bearish on HTFs DW
Entry at both Daily and Weekly AOi
Weekly Rejection at AOi
Previous Weekly Structure Point
Daily Rejection At AOi
Daily previous Structure point
Around Psychological Level 0.89500
H4 Candlestick rejection
Levels 5.41
Entry 95%
REMEMBER : Trading is a Game Of Probability
: Manage Your Risk
: Be Patient
: Every Moment Is Unique
: Rinse, Wash, Repeat!
: Christ is King.

AUD/CAD For Bullishyou can go long now
or
wait for pull-back near by entry point and then go long
general trend is up trend
have fun :)

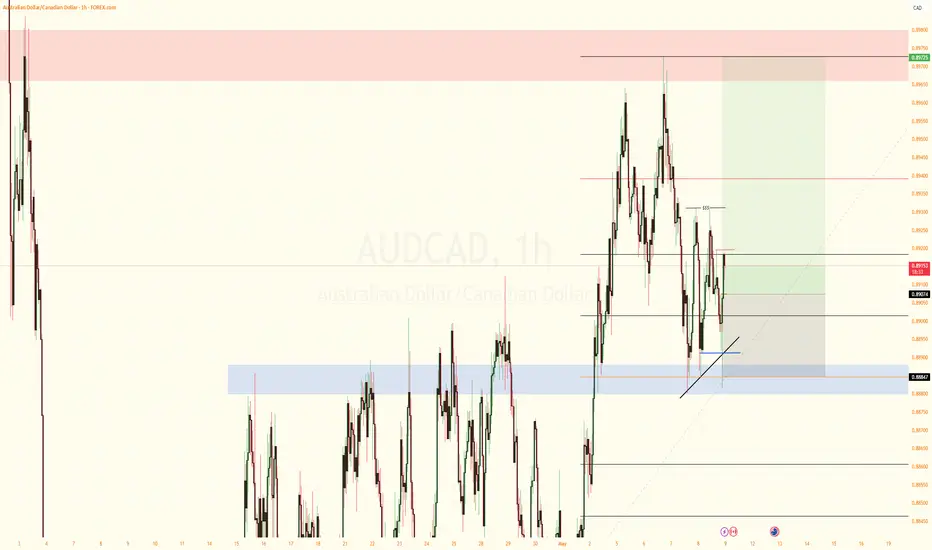
AUDCAD: More Growth Ahead?! 🇦🇺🇨🇦
AUDCAD bounced strongly after a test of a significant daily/intraday support cluster.
The price managed to violate a resistance line of a falling wedge
pattern and close above that on an hourly time frame.
I expect a movement higher at least to 0.8944
❤️Please, support my work with like, thank you!❤️

AUDCAD 1 hour possible Double Bottom📉 Technical Overview
1. Pattern in Formation: Potential Double Bottom
Price action suggests a potential double bottom pattern forming around the 0.88800–0.88900 support area.
A neckline is clearly identified around the 0.89300 level.
Price is currently between the second low and the neckline — an important “watch zone.”
2. Confirmation Required
The double bottom is not confirmed yet.
A valid long trade setup would require a clear breakout and close above 0.89300 (neckline resistance).
3. Target & Risk
The projected move (measured from the neckline to the bottom of the pattern) gives a target around 0.89740.
That’s approximately +42–43 pips from the breakout point, offering decent risk-to-reward potential.
✅ Trade Idea (Upon Confirmation)
Buy Entry: After a 1H candle closes above 0.89300.
Stop Loss: Below the second bottom – around 0.88900 or slightly below.
Take Profit: Around 0.89740 (measured target of the pattern).
Risk:Reward Ratio: Approx. 1:2, favorable for a breakout trade.
⚠️ Caution
If price fails to break above the neckline and reverses, it may revisit the 0.88800 zone or even break down — invalidating the setup.
Monitor Canadian and Australian economic news, especially commodity data or employment figures, for volatility spikes.

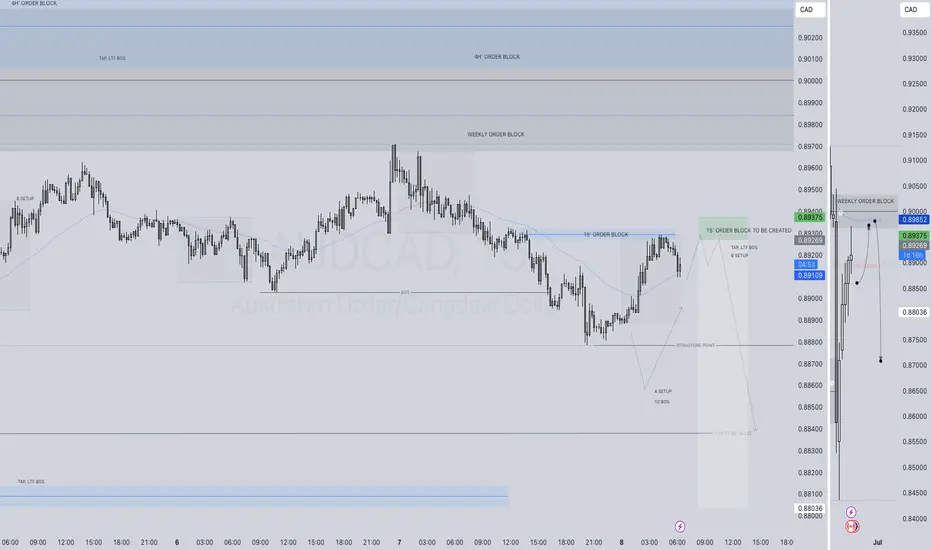
AUDCAD SHORT FORECAST Q2 W19 D8 Y25AUDCAD SHORT FORECAST Q2 W19 D8 Y25
Professional Risk Managers👋
Welcome back to another FRGNT chart update📈
Diving into some Forex setups using predominantly higher time frame order blocks alongside confirmation breaks of structure.
Let’s see what price action is telling us today!
💡Here are some trade confluences📝
✅ Weekly order block
✅Intraday 15 order block
✅Tokyo ranges to be filled
✅Intraday bearish breaks of structure to be confirmed
🔑 Remember, to participate in trading comes always with a degree of risk, therefore as professional risk managers it remains vital that we stick to our risk management plan as well as our trading strategies.
📈The rest, we leave to the balance of probabilities.
💡Fail to plan. Plan to fail.
🏆It has always been that simple.
❤️Good luck with your trading journey, I shall see you at the very top.
🎯Trade consistent, FRGNT X
A possible short trade Buyers losing momentum as RSI declines. We a little late to the party therfore we will seat in our hands patiently and wait for a second chance to get in.
AUDCAD Technical & Order Flow AnalysisOur analysis is based on multi-timeframe top-down analysis & fundamental analysis.
Based on our view the price will fall to the monthly level.
DISCLAIMER: This analysis can change anytime without notice and is only for assisting traders in making independent investment decisions. Please note that this is a prediction, and I have no reason to act on it, and neither should you.
Please support our analysis with a boost or comment!

audcad longThe lines represents yesterday's high and Low, As you can see yesterday's high has been taken out. In this time,, We are looking t*9o buy at the current rate, targeting yesterday's high

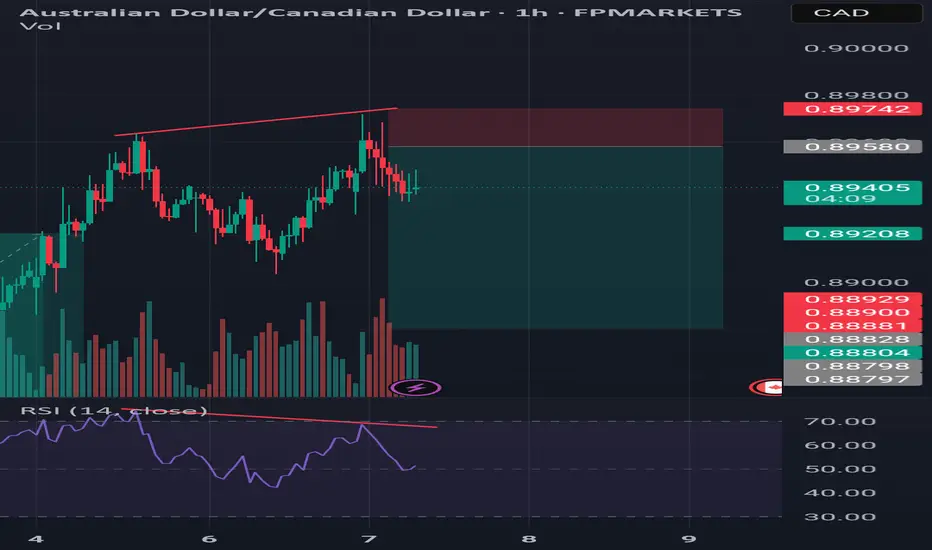
AUDCAD – Bearish Divergence on 1H & 4HAUDCAD – Bearish Divergence on 1H & 4H Charts 🐻⚠️ Multi-Timeframe Confluence
Hey traders 👋
AUDCAD is showing bearish divergence across both 1H and 4H timeframes, and that’s not something we brush off lightly. When multiple timeframes agree, it’s often a high-probability signal — let’s break it down.
🔻 1H Divergence – Momentum Cracks Appearing
On the 1-hour chart, price has been grinding higher, forming a series of higher highs — but here’s the catch: RSI is printing lower highs.
That’s bearish divergence in its purest form. Momentum is clearly not confirming the new highs, meaning the bulls are pushing, but not with strength. It's a sign of buyer exhaustion — and potentially, a trap for late longs.
⏳ 4H Divergence – A Bigger Picture Warning
Zooming out to the 4-hour chart, the same divergence is present. Price keeps nudging higher, but the RSI continues to lag behind. This isn’t just noise — it’s a red flag.
Divergence on the 4H chart means we could be due for a larger correction or even a reversal, not just a quick dip. Add that to the 1H signal and you've got a bearish confluence.
📌 What to Watch
A break of short-term support could confirm the divergence playing out
Lower highs forming after divergence = strong entry signals
Bearish engulfing candle or trendline break = go-time for many traders
Be patient — wait for structure to break before committing. This isn’t about guessing; it’s about letting price action do the talking.
🎯 Final Thoughts
With divergence across 1H and 4H, the setup is solid. Momentum is fading, and a shift could be just around the corner. Whether you’re day trading or looking for a swing entry, this is prime time to watch AUDCAD closely.

AUD/CAD - Short Trade IdeaThis is a long Term View for a sell position on the 4D TF.
My view on this Bearish movement is that we are respecting the swing from this Supply zone and that we will be rejecting this supply zone taking this previous Sell side Liquidity.
Price has been slowing down whilst approaching this Supply zone giving me confluence of the build up of Selling momentum.
We are below our EMA and we are also holding sellers momentum from the beginning of the year
Good Luck to any traders that will be following this setup

AUDCAD | Point of confluenceAUDCAD is in bullish trend.Both trendline and Fib retracement are meeting at the same point.

AUDCAD: Bullish Continuation After ConsolidationAUDCAD was consolidating in a sideways pattern for over two weeks on the daily chart.
It broke through its resistance with a strong bullish move yesterday, suggesting potential for further growth.
The next resistance level is at 0.900.

AUDCADGiven the strengthening of the Australian dollar and the failure of the target level, the probability of reaching the target is high.