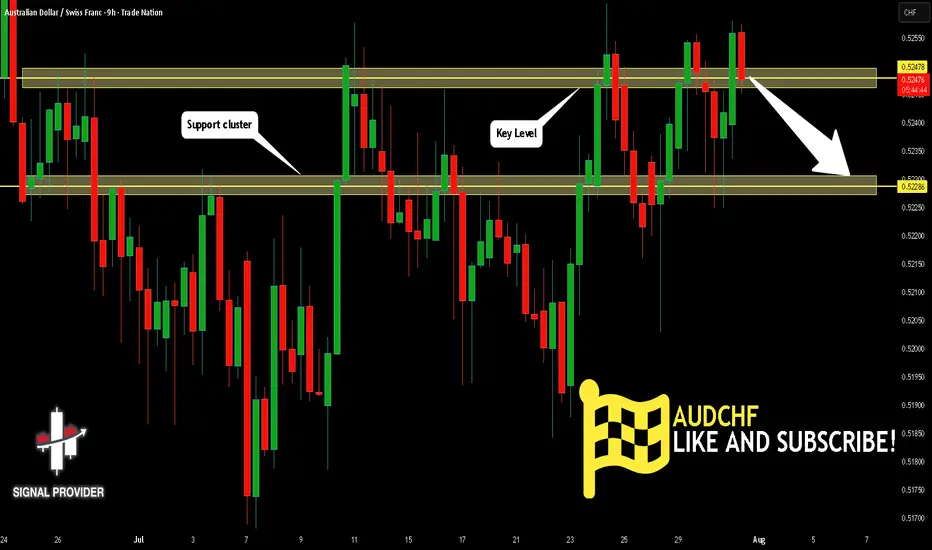
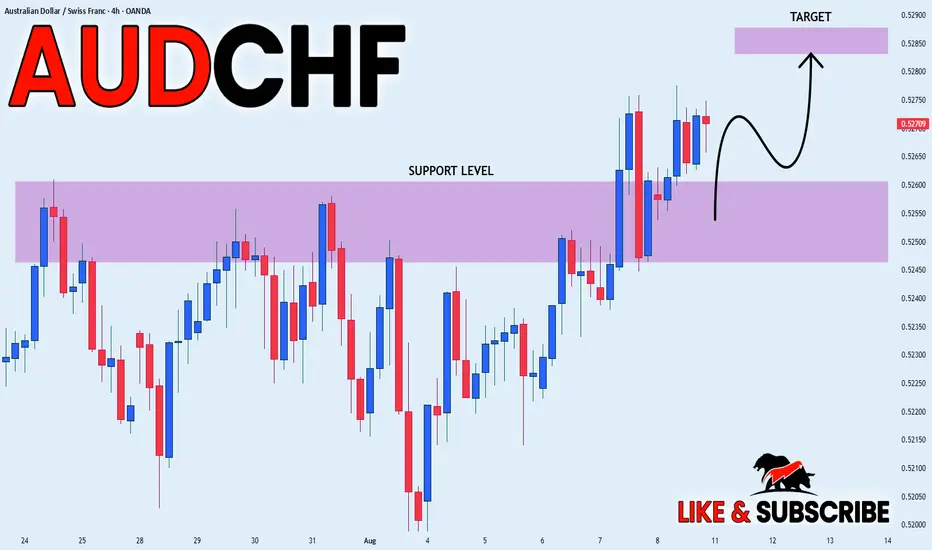
AUDCHF - Already Overbought!Hello TradingView Family / Fellow Traders. This is Richard, also known as theSignalyst.
📈AUDCHF has been overall bullish trading within the rising channel marked in red and it is currently retesting the upper bound of the channel acting as an over-bought zone.
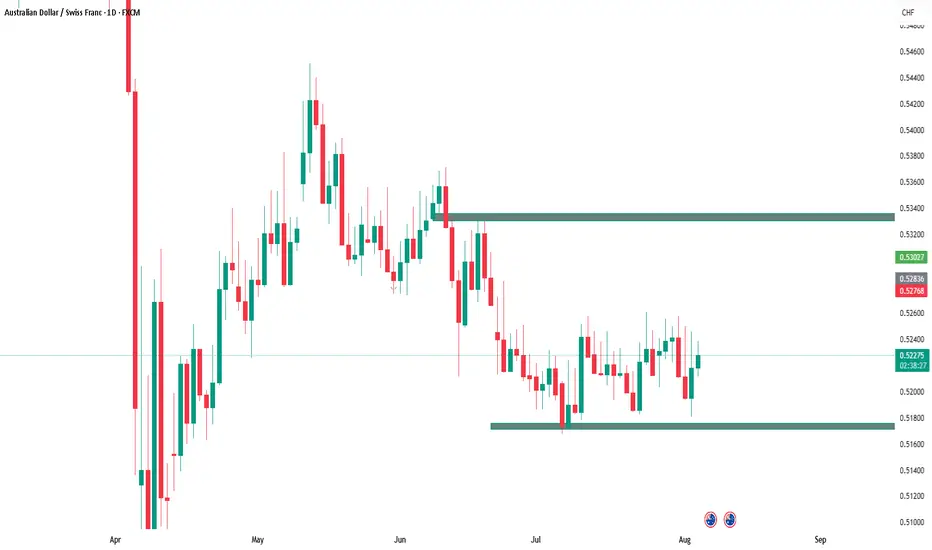
Moreover, the blue zone is a strong weekly resistance.
📚 As per my trading style:
As #AUDCHF approaches the red circle zone, I will be looking for bearish reversal setups (like a double top pattern, trendline break , and so on...)
📚 Always follow your trading plan regarding entry, risk management, and trade management.
Good luck!
All Strategies Are Good; If Managed Properly!
~Rich
Disclosure: I am part of Trade Nation's Influencer program and receive a monthly fee for using their TradingView charts in my analysis.
AUDCHF trade ideas

BUY AUDCHFwait for price to react to 4h bullish FVG and look to enter on lower time frames for a 1:3rr BUY/LONG


AUDCHF: This Rally’s Just a Breath Before the DropAUDCHF: This Rally’s Just a Breath Before the Drop 🪂
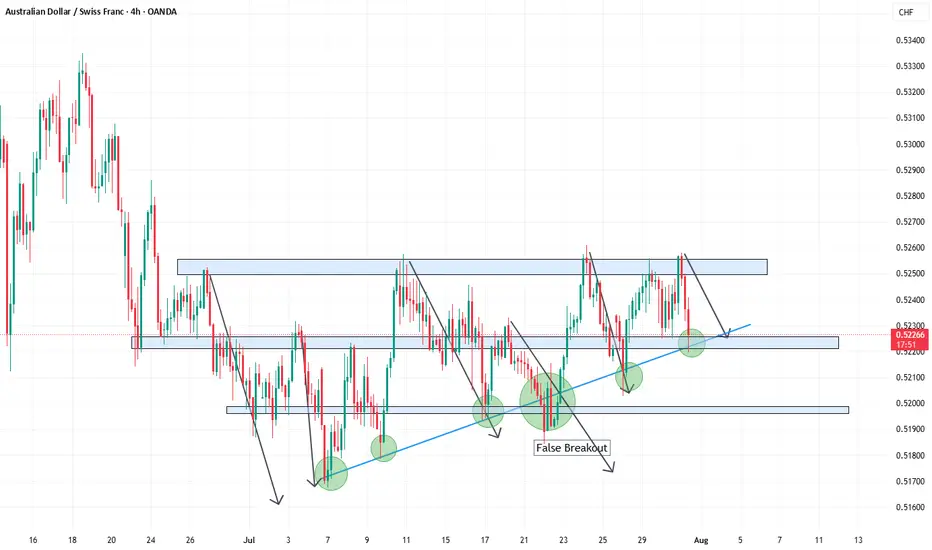
Sometimes, what looks like strength is just the market catching its breath. AUDCHF is trading at resistance after a clean break of the trendline — and I’m leaning bearish. The short-term bounce might have legs, but I’m positioning for a sell if price starts to roll over here.
📉 Trade Bias: I’m looking to short AUDCHF, now that the pair is retesting resistance within a broader downtrend.
Here’s what’s on my radar:
🇦🇺 The RBA is expected to cut rates in August — 98% probability 📉
🇨🇭 SNB has already cut to 0.0%, but is unlikely to go negative again
🛍️ Australia’s consumer spending is still weak despite inflation cooling
🛡️ CHF remains in demand as a global safe-haven
🔄 COT positioning shows long-term bearish sentiment on AUD remains intact
Australia’s recent strength isn’t rooted in internal fundamentals — it's driven by global risk appetite. But now, with a looming RBA rate cut and cautious spending data, that optimism may not last. Inflation is soft, growth is sluggish, and trade barriers still hang in the air.
The Swiss franc, on the other hand, continues to benefit from its status as a safe-haven. While some short-term pullbacks are possible on improving global trade sentiment, CHF has held its ground due to its solid fiscal position and low inflation. Traders are still favoring it in times of uncertainty.
If price confirms reversal here, I’m taking the shot. The structure’s clean, the macro lines up, and risk-reward is leaning in my favor.
I’ve got the trigger finger ready — just waiting on the chart to blink. Would you fade this bounce?

AUD/CHF BEARS ARE STRONG HERE|SHORT
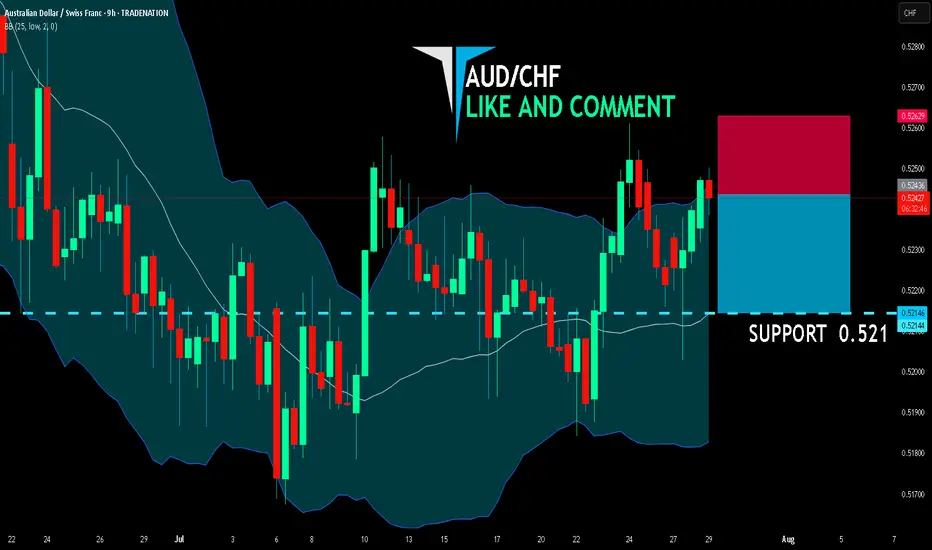
AUD/CHF SIGNAL
Trade Direction: short
Entry Level: 0.524
Target Level: 0.521
Stop Loss: 0.526
RISK PROFILE
Risk level: medium
Suggested risk: 1%
Timeframe: 9h
Disclosure: I am part of Trade Nation's Influencer program and receive a monthly fee for using their TradingView charts in my analysis.
✅LIKE AND COMMENT MY IDEAS✅
short on audchfthe uptrend is reverse and price break the last HL strongly and pullback to broken support reach to a supply zone too...

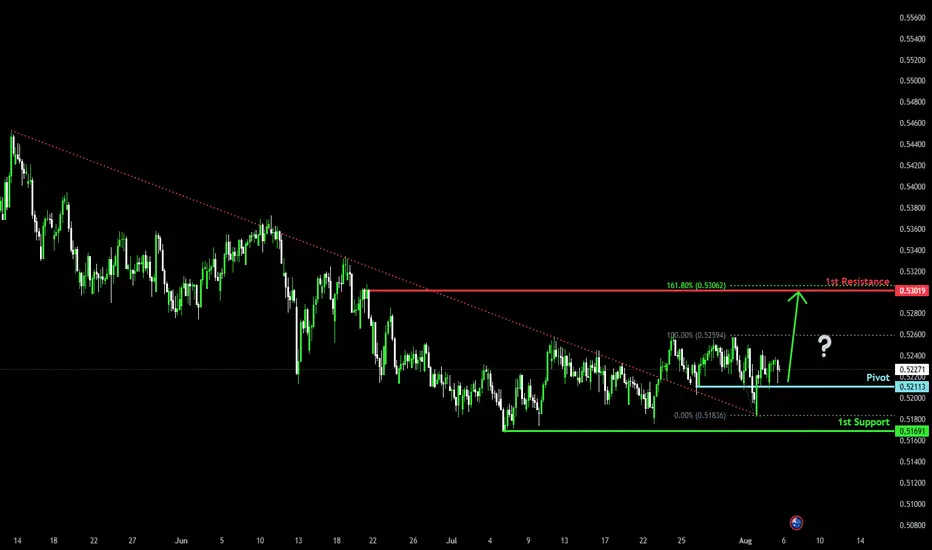
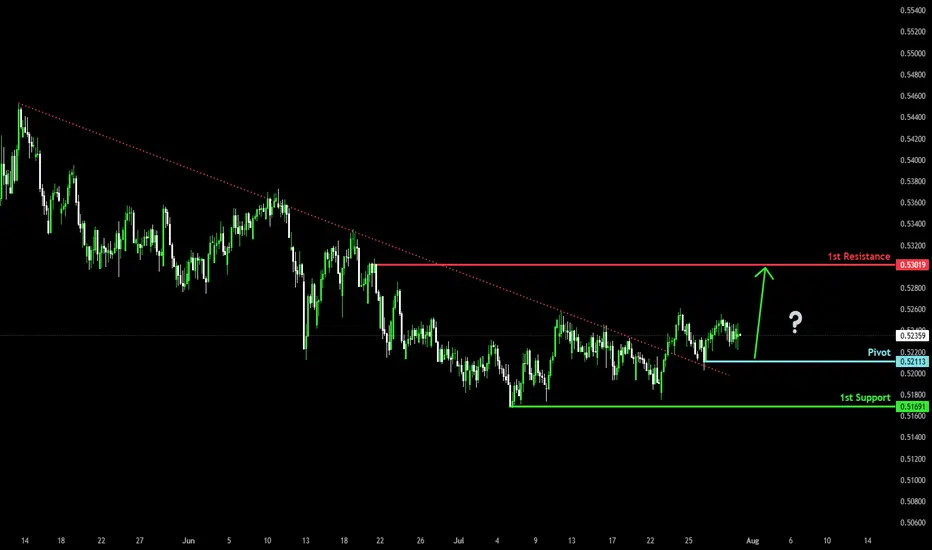
Bullish reversal?AUD/CHF is falling towards the pivot and could bounce to he 1st resistance which is a pullback resistance that lines up with the 161.8% Fibonacci extension.
Pivot: 0.52113
1st Support: 0.51691
1st Resistance: 0.53019
Risk Warning:
Trading Forex and CFDs carries a high level of risk to your capital and you should only trade with money you can afford to lose. Trading Forex and CFDs may not be suitable for all investors, so please ensure that you fully understand the risks involved and seek independent advice if necessary.
Disclaimer:
The above opinions given constitute general market commentary, and do not constitute the opinion or advice of IC Markets or any form of personal or investment advice.
Any opinions, news, research, analyses, prices, other information, or links to third-party sites contained on this website are provided on an "as-is" basis, are intended only to be informative, is not an advice nor a recommendation, nor research, or a record of our trading prices, or an offer of, or solicitation for a transaction in any financial instrument and thus should not be treated as such. The information provided does not involve any specific investment objectives, financial situation and needs of any specific person who may receive it. Please be aware, that past performance is not a reliable indicator of future performance and/or results. Past Performance or Forward-looking scenarios based upon the reasonable beliefs of the third-party provider are not a guarantee of future performance. Actual results may differ materially from those anticipated in forward-looking or past performance statements. IC Markets makes no representation or warranty and assumes no liability as to the accuracy or completeness of the information provided, nor any loss arising from any investment based on a recommendation, forecast or any information supplied by any third-party.
AUD overbought versus CHFBased on currency strengths, the AUD is weaker than the CHF and AUDCHF has reached a significant level. The odds are of a retracement.

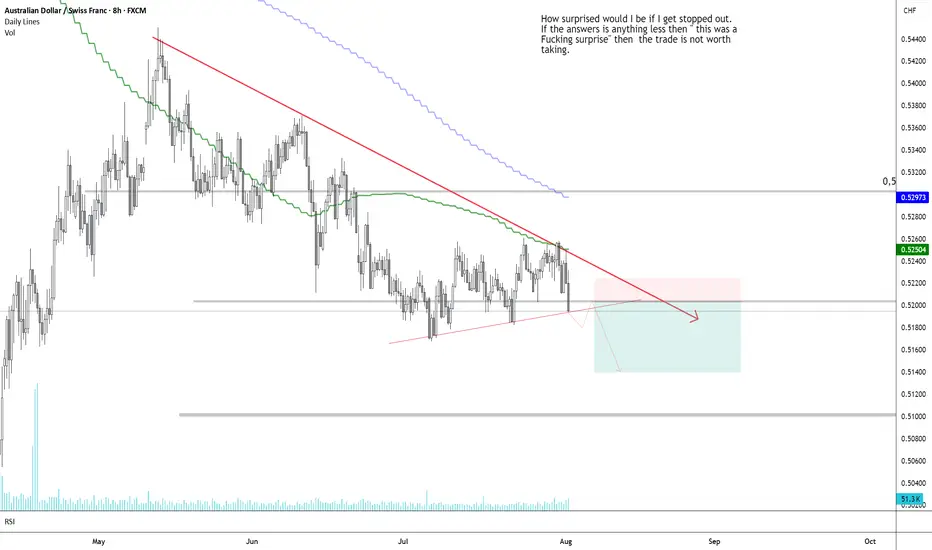
Short ideaLooks like a continuation to the downside. Some strong round levels but news is early in the morning so risky.
AUDCHF(4/08/2025)Prices Approaching Resistance, Sell On StrengthSell below 5230 Stop Loss at 5248 Take Profit at 5200
Price is approaching our resistance level at 0.52306
We expect a strong reaction to occur below this level, pushing price down to our major support at 0.51890

Bullish bounce off pullback support?AUD/CHF is falling towards the pivot, which is a pullback support and could bounce to the 1st resistance.
Pivot: 0.52113
1st Support: 0.51691
1st Resistance: 0.53019
Risk Warning:
Trading Forex and CFDs carries a high level of risk to your capital and you should only trade with money you can afford to lose. Trading Forex and CFDs may not be suitable for all investors, so please ensure that you fully understand the risks involved and seek independent advice if necessary.
Disclaimer:
The above opinions given constitute general market commentary, and do not constitute the opinion or advice of IC Markets or any form of personal or investment advice.
Any opinions, news, research, analyses, prices, other information, or links to third-party sites contained on this website are provided on an "as-is" basis, are intended only to be informative, is not an advice nor a recommendation, nor research, or a record of our trading prices, or an offer of, or solicitation for a transaction in any financial instrument and thus should not be treated as such. The information provided does not involve any specific investment objectives, financial situation and needs of any specific person who may receive it. Please be aware, that past performance is not a reliable indicator of future performance and/or results. Past Performance or Forward-looking scenarios based upon the reasonable beliefs of the third-party provider are not a guarantee of future performance. Actual results may differ materially from those anticipated in forward-looking or past performance statements. IC Markets makes no representation or warranty and assumes no liability as to the accuracy or completeness of the information provided, nor any loss arising from any investment based on a recommendation, forecast or any information supplied by any third-party.
Sell AUDCHFButterfly pattern on display on the AUDCHF chart. This confirms a double top. On the M15 entry level timeframe, a bearish flag can be seen indicating strong bearish movement to come.


AUDCADThe price is currently at a key level. We need confirmation on the 15-minute or 5-minute timeframe before considering a long entry.
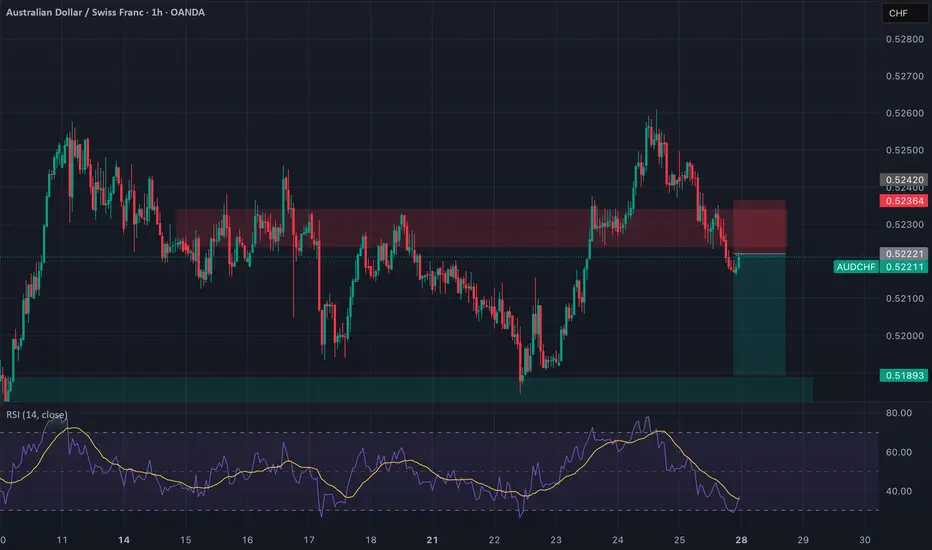
AUDCHF: Broken Support, Bearish Flow In Play Timeframe: 1H
Bias: Bearish
Type: Support Turncoat → Breakdown Play
📊 Technical Setup
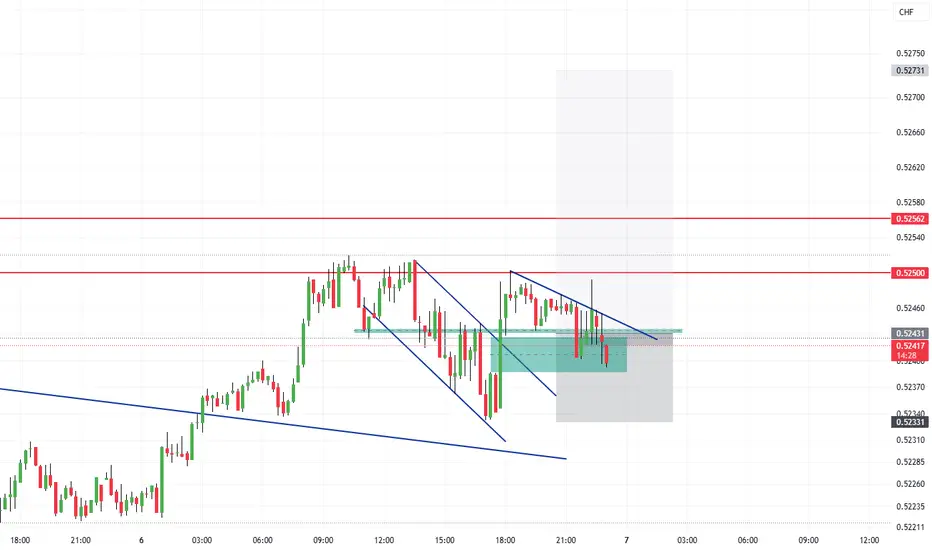
AUDCHF previously broke the 4H resistance (0.5236) which flipped to support. However, price has now broken below this support, confirming it as a failed demand zone.
• Entry: Market execution or retest of 0.5236
• SL: Above 0.5245
• TP: 0.5189
• RR: ~1:2
• RSI: Below 50 and heading lower = momentum supports downside
📉 Macro & Fundamental Confluence
• AUD Weakness: RBA dovish, conditional score declining, bearish seasonality
• CHF Slightly Less Weak: Despite SNB dovish stance, CHF is outperforming AUD
• COT + Sentiment: AUD CFTC weakening, CHF holding steady
• Risk Sentiment: RISK ON environment reduces CHF demand but AUD still underperforms
🧭 Gameplan
“Support failed to hold. Bearish pressure intensifies. Target previous swing low zone.”
🔔 Watch for retest of 0.5236 for better RR setup before continuing short.
AUDCHF Will Go Down! Short!
Here is our detailed technical review for AUDCHF.
Time Frame: 9h
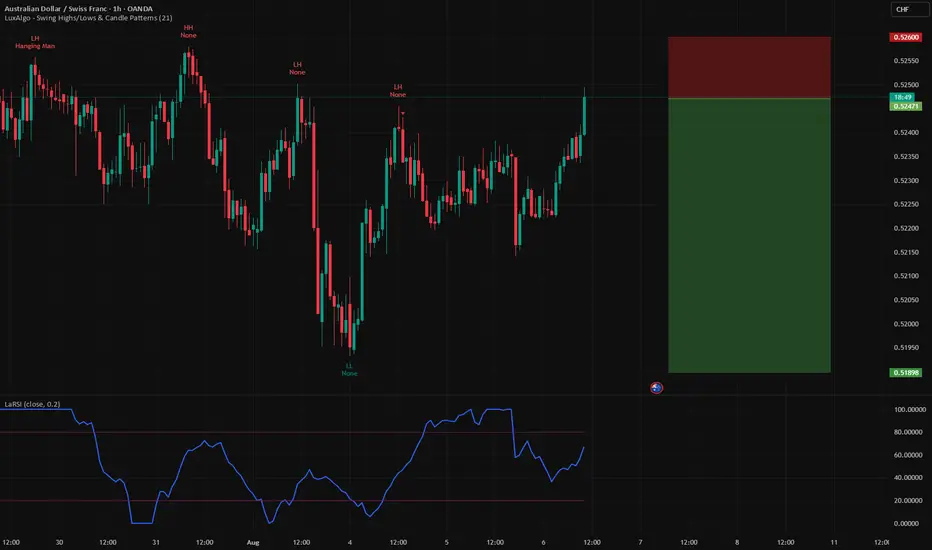
Current Trend: Bearish
Sentiment: Overbought (based on 7-period RSI)
Forecast: Bearish
The market is on a crucial zone of supply 0.524.
The above-mentioned technicals clearly indicate the dominance of sellers on the market. I recommend shorting the instrument, aiming at 0.522 level.
P.S
Please, note that an oversold/overbought condition can last for a long time, and therefore being oversold/overbought doesn't mean a price rally will come soon, or at all.
Disclosure: I am part of Trade Nation's Influencer program and receive a monthly fee for using their TradingView charts in my analysis.
Like and subscribe and comment my ideas if you enjoy them!

AUD_CHF WILL KEEP GROWING|LONG|
✅AUD_CHF is trading in an uptrend
And the pair was making a bearish correction
But has now retested the support of 0.5255
And we are already seeing a rebound
So we will be expecting a further move up
LONG🚀
✅Like and subscribe to never miss a new idea!✅
AUDCHF potential LONG positionAUDCHF Analysis (4H / Weekly Confluence)
The overall trend remains bullish, following a strong rejection from weekly resistance. This move was supported by a bullish Bat harmonic pattern, which marked a potential reversal point.
Price has since been forming an ascending triangle structure, with higher lows consistently pressing against a flat resistance near 0.5265. This pattern often signals accumulation and builds pressure for a breakout.
Momentum indicators like RSI also support the bullish bias, as the market compresses under key resistance.
I’m watching for a confirmed breakout above 0.5265, ideally followed by a brief retracement into the swap zone, before continuation upward.
Target Levels:
TP1: 0.5350
TP2: 0.5400
Let’s see how this plays out. Open to feedback and alternate views!

My idea on audchfwhat do you think ?
we had an impulsive move then a corrective one, after we broke it.
I think we have a better probability to go up.

Update on AUDCHF – Sitting Out the Storm🔄 Update on AUDCHF – Sitting Out the Storm ⏸️
Just a few days ago, I was eyeing a clean short on AUDCHF. The pair was rejecting resistance, macro favored CHF, and the setup was aligning nicely for a downside play.
But markets don’t move in a vacuum — and Trump’s 39% tariff on Swiss imports, set to take effect tomorrow, just shattered the clean setup.
This changes everything.
📉 Original Thesis:
RBA likely to cut ➡️ AUD weakness
CHF supported by safe-haven demand and stable fundamentals
AUDCHF bouncing into resistance within a broader downtrend
⚠️ New Reality:
🇺🇸 A 39% tariff on Swiss goods injects massive political risk into CHF
🇨🇭 This isn’t a typical risk-off environment anymore — it’s risk against the franc
💣 Safe-haven flows into CHF may dry up or reverse as capital reacts to trade friction
📊 The clean technical structure is now compromised by unquantifiable news risk
🚫 Trade Bias: Neutral – No Trade
I’m stepping aside from AUDCHF for now. The macro case for CHF strength has been undermined, but I’m not convinced AUD is strong enough to buy either. This isn’t a setup — it’s noise, volatility, and uncertainty with no edge.
In FX, uncertainty = risk without reward. Discipline is knowing when not to trade.
I’m keeping it on watch, but until this tariff fallout clears or the chart gives something cleaner, I’m on the sidelines.
Would you still touch this pair with that tariff risk looming?
Because for me — the edge is gone.
AUDCHFTHE SWING ANALYSIS
Follow for more Simple And accurate swing analysis on Indices, Currency, Commodities.