EURAUD The 1D MA50 is the sell signalThe EURAUD pair had been trading within a Channel Down pattern since the August 17 2023 High. At the moment it has made a direct Lower High (December 27 2024) at the top of the pattern but the rejection is contained above the 1D MA50 (blue trend-line).
That is the sell confirmation level as whenever this broke after a Lower High, we had a bearish signal. As a result, wait for a bearish break-out and then sell, targeting the 1W MA300 (red trend-line) at 1.61000.
-------------------------------------------------------------------------------
** Please LIKE 👍, FOLLOW ✅, SHARE 🙌 and COMMENT ✍ if you enjoy this idea! Also share your ideas and charts in the comments section below! This is best way to keep it relevant, support us, keep the content here free and allow the idea to reach as many people as possible. **
-------------------------------------------------------------------------------
💸💸💸💸💸💸
👇 👇 👇 👇 👇 👇
AUDEUR trade ideas

euraud sell signal. Don't forget about stop-loss.
Write in the comments all your questions and instruments analysis of which you want to see.
Friends, push the like button, write a comment, and share with your mates - that would be the best THANK YOU.
P.S. I personally will open entry if the price will show it according to my strategy.
Always make your analysis before a trade

EURAUD - Bullish Rectangular patternAfter its bullish move the pair is consolidating at its fib level of 0.5-0.618. Entry can be taken a entry of the box with SL below th base of the box.

LONGS SOON?Looking to buy EURAUD. Double bottom with a more recent Inverted Head and Shoulders pattern. 1.6500, 61.8 as confluences.

Could EURAUD be transitioning into a bearish trend?EURAUD has not managed to break its horizontal resistance, marked by a double top. A bearish channel has formed, where we could see a rebound. The next support levels offer a good Risk-Reward Ratio (RRR).

EurAud wave B analysisIn my opinion, we are in the correction of wave B, triangle doubt (ABCDE)
Now we are in small wave (d) of 2 hours and 4 hours time frame
Pay attention to the picture carefully

How I lost 1R on EURAUD SellHello traders!!
What I saw here was a potential continuation of a move, I saw a triangle pattern and thought this could possibly go lower.
Took my trade on the retest but got Sl hunted which is not very common in my strategy.
Even the pivot point was looking good

EURAUD wave BIn my opinion, we are in the correction of wave B, triangle doubt (ABCDE)
Now we are in small wave (D) of 2 hours and 4 hours time frame
Pay attention to the picture carefully

EURUAD SellIt has a good reaction to the supply area and the probability of hitting the target is very high

EURAUD Buyers In Panic! SELL!
My dear subscribers,
This is my opinion on the EURAUD next move:
The instrument tests an important psychological level 1.6597
Bias - Bearish
Technical Indicators: Supper Trend gives a precise Bearish signal, while Pivot Point HL predicts price changes and potential reversals in the market.
Target - 1.6575
About Used Indicators:
On the subsequent day, trading above the pivot point is thought to indicate ongoing bullish sentiment, while trading below the pivot point indicates bearish sentiment.
———————————
WISH YOU ALL LUCK

EURAUD - Potential Short from Resistance ZoneThe EURAUD pair is approaching a significant resistance zone. The current bullish momentum into this area may provide an opportunity for sellers to regain control.
A bearish confirmation, such as rejection patterns, bearish engulfing candles, or signs of slowing momentum, would increase the likelihood of a pullback. If the resistance holds, the price could target the 1.66150 level.
Traders should monitor for confirmation of selling pressure before initiating short positions. This setup aligns with a potential corrective move within the broader market structure.

EURAUD is going to sell short time---------------------------
EURAUD going to sell
---------------------------
based on our analysis EURAUD in going to short position.
this is a personal analysis do your research before enter a position.

EURAUD Locally Overbought!
HI,Traders !
EURAUD is trading in a
Strong uptrend but the
Pair is locally overbought so
After the retest of the
Horizontal resistance level
Of 1.66691 from where
We will be expecting a
Local bearish correction !
Comment and subscribe to help us grow!

EURAUD: Will Keep Falling! Here is Why:
The recent price action on the EURAUD pair was keeping me on the fence, however, my bias is slowly but surely changing into the bearish one and I think we will see the price go down.
❤️ Please, support our work with like & comment! ❤️

EURAUD SHORTMarket structure bearish on HTFs DH
Entry at both Weekly and Daily AOi
Weekly Rejection at AOi
Daily Rejection At AOi
Previous Structure point Daily
Around Psychological Level 1.66500
H4 EMA retest
H4 Candlestick rejection
Rejection from Previous structure
Levels 7.49
Entry 90
REMEMBER : Trading is a Game Of Probability
: Manage Your Risk
: Be Patient
: Every Moment Is Unique
: Rinse, Wash, Repeat!
: Christ is King.

EURAUD selling Trading IdeaHello Traders
In This Chart EUR/AUD 4 HOURLY Forex Forecast By FOREX PLANET
today EUR/AUD analysis 👆
🟢This Chart includes_ (EUR/AUD market update)
🟢What is The Next Opportunity on EUR/AUD Market
🟢how to Enter to the Valid Entry With Assurance Profit
This CHART is For Trader's that Want to Improve Their Technical Analysis Skills and Their Trading By Understanding How To Analyze The Market Using Multiple Timeframes and Understanding The Bigger Picture on the Charts

EURAUD: Bullish Outlook Explained 🇪🇺 🇦🇺
EURAUD looks bullish after a false breakout of a significant
intraday/daily demand zone.
As a confirmation, I see a bullish imbalance and a violation
of an intraday horizontal resistance on an hourly time frame.
I expect a movement up at least to 1.6596
❤️Please, support my work with like, thank you!❤️

EURAUD possible ideaFrom our previous idea, price moved as anticipated but failed to close below our weak low. It only wicked with an asia session low, thus forming more liquidity around the weak low price failed to break. Within the range, on lower timeframe, price moved aggressively, leaving behind a clean 1 hour supply zone before it preceded to break structure. Price has currently formed asia session liquidity below this POI that it could use to fuel its move to run the weak low as well as the liquidity below asia low.

EURAUD updated ideaFrom our previous idea, we expected price to first sweep bearish trendline liquidity before we get a shift of market structure. Instead, it was vice versa, but the idea still remains the same with just a new entry point. We have currently shifted to a bearish market on lower timeframe after mitigating our previously established supply zone. Now we have an opportunity to short the market on a 15 min confirmation entry.

Possible Sell Opportunity on EURAUDPrice is trending downwards. We are looking for the pullback to the level to take the trade.

EURAUD is positioning for another bearish moveDaily closed candle yesterday showed a strong bearish candle engulfed the lowest price of the day before hinting of strong bearish pressure.
I'm expecting further down movement as per drawn in chart.
What do you think? Mind to share your thought.
Good Luck & Happy trading.

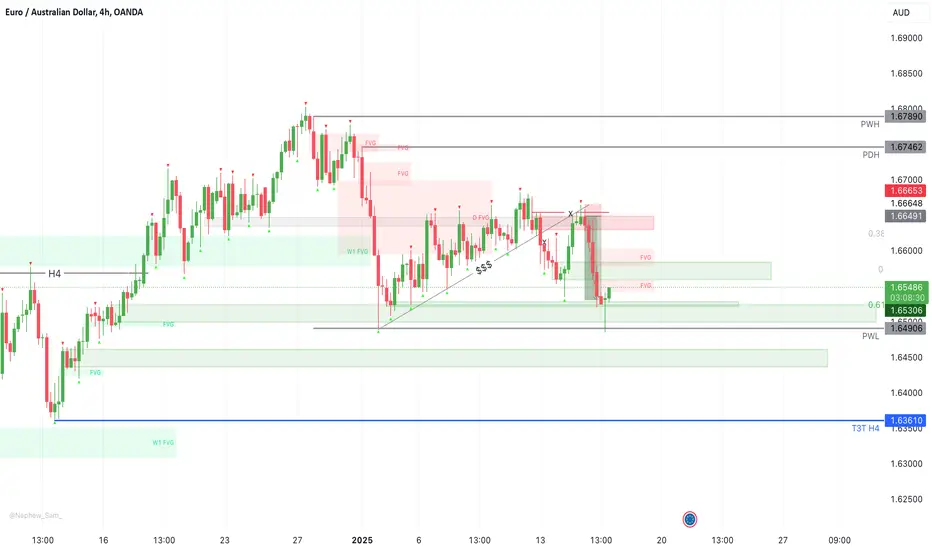
Counter-Trend Upside Pullback After Liquidity SweepW1: The higher timeframe shows an uptrend, but the current wave is downward. Price is trading within the boundaries of PWL (Previous Week Low) and PWH (Previous Week High), indicating a corrective phase within the broader trend.
D1: The dominant trend is also upward, with the current wave downward, acting as a correction within the larger structure.
H4: A deep correction of over 61.8% has occurred. Trend liquidity has been taken out, followed by a pullback to the trendline, and another liquidity sweep, signaling a potential continuation of the corrective move.
Trade Idea:
This counter-trend setup aims to join the downward corrective wave of the larger uptrend. The liquidity sweeps, combined with a pullback to the trendline, provide potential entry opportunities for short positions, targeting the completion of the correction.
Key Levels:
Resistance: Around the trendline and liquidity sweep zones.
Bullish order block: Potential targets
Recommendation:
Look for confirmation of the continuation of the downward wave, such as price stalling without breaking previous candle highs or lows, trendline rejections, or engulfing candle with the retest.
Risks:
A sudden reversal in alignment with the larger uptrend could invalidate the trade idea.
Liquidity sweeps can lead to false breakouts, especially in corrective phases.
Conclusion:
This idea targets a short-term opportunity to align with the corrective downward wave of the larger uptrend. By leveraging liquidity structure and trendline interactions, traders can identify precise entry points while maintaining tight risk control.
EURAUDThe break of 1.65367 for EURAUD on the daily timeframe is a significant development, indicating a potential trend reversal. But Sydney and Asian might buy back upto 0.6 fib level of yesterday sell candle and sell down from that level
2. Support Turned Resistance: The broken support level may now act as resistance, making it challenging for the pair to recover.
3. Targeting Lower Levels: The bearish confirmation suggests that EURAUD may target lower levels, potentially testing the next support zone which is also a demand floor and we will be watching the EUR BOND YIELD AND AUD BOND YIELD FOR CLEAR DIRECTIONAL BIAS.
