EURAUD Long TradeOANDA:EURAUD Long trade, with my back testing of this strategy, it hits multiple possible take profits, manage your position accordingly.
TP-1 is high probability.
This is good trade, don't overload your risk like greedy, be disciplined trader, this is good trade.
Use proper risk management
Looks like good trade.
Lets monitor.
Use proper risk management.
Disclaimer: only idea, not advice
AUDEUR trade ideas

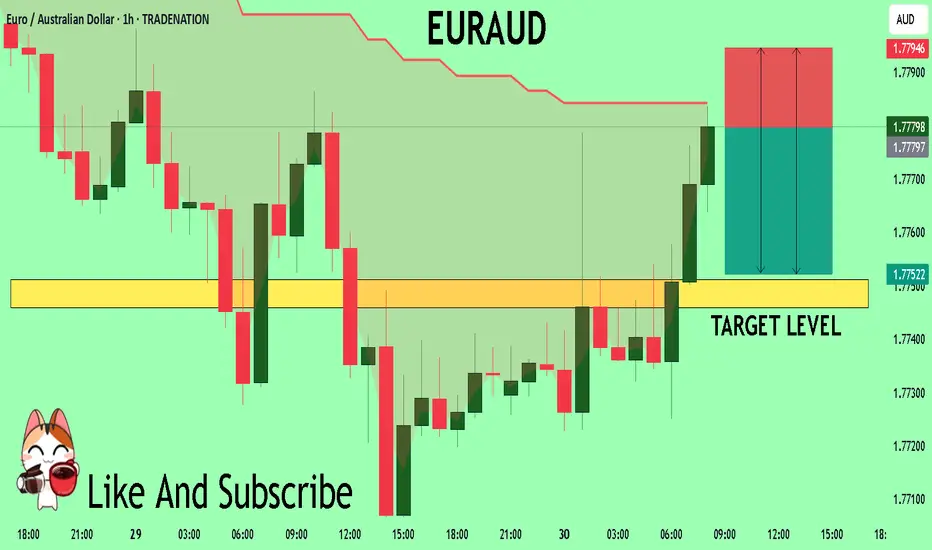
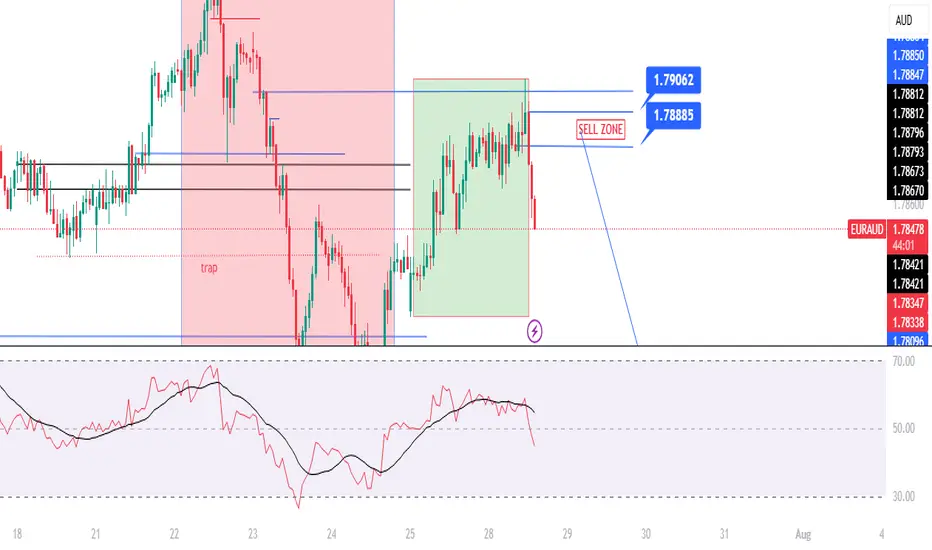
EURAUD Under Pressure! SELL!
My dear followers,
I analysed this chart on EURAUD and concluded the following:
The market is trading on 1.7780 pivot level.
Bias - Bearish
Technical Indicators: Both Super Trend & Pivot HL indicate a highly probable Bearish continuation.
Target - 1.7751
Safe Stop Loss - 1.7794
About Used Indicators:
A super-trend indicator is plotted on either above or below the closing price to signal a buy or sell. The indicator changes color, based on whether or not you should be buying. If the super-trend indicator moves below the closing price, the indicator turns green, and it signals an entry point or points to buy.
Disclosure: I am part of Trade Nation's Influencer program and receive a monthly fee for using their TradingView charts in my analysis.
———————————
WISH YOU ALL LUCK
EURAUD Potential Bearish Setup Distribution pattern with breakdown below key support suggests downside momentum.
Break above our Resistance zone will invalidate our trade setup; good idea to watch out if that happens.
- Breakdown Level: 1.77694 -1.77722
- Entry Strategy: Sell orders at BOS
- Stop Loss: Above Resistance zone
- Target Zones:
- Primary Target: Target 1 (R:R 1:2)
- Secondary Target: Target 2 (R:R 1:3)
- Extension Target: Target 3 (R:R 1:4)
Bearish/Bullish Confirmations:
🔻 Rejection candlestick patterns
🔻 Bearish Reversal patterns
🔻 Impulsive moves in line with setups directional bias
Position Management:
- Exit: Partial profits at targets
- Stop adjustment: Trail stops when target are hit
LIKE or COMMENT if this idea sparks your interest, or share your thoughts below!
FOLLOW to keep up with fresh ideas.
Tidypips: "Keep It Clean, Trade Mean!"

EURAUD; Heikin Ashi Trade IdeaIn this video, I’ll be sharing my analysis of EURAUD, using FXAN's proprietary algo indicators with my unique Heikin Ashi strategy. I’ll walk you through the reasoning behind my trade setup and highlight key areas where I’m anticipating potential opportunities.
I’m always happy to receive any feedback.
Like, share and comment! ❤️
Thank you for watching my videos! 🙏

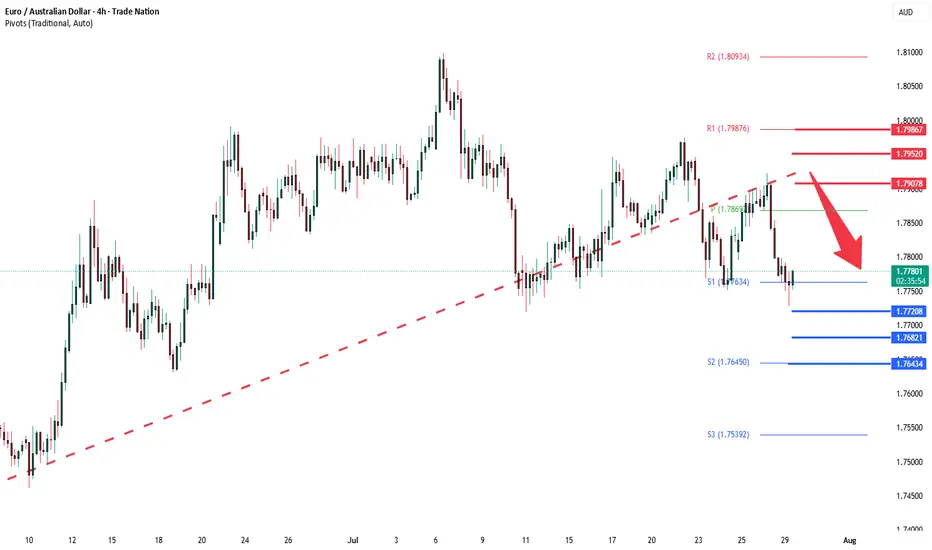
EURAUD oversold bounce backs capped at 1.7907The EURAUD pair is currently trading with a bearish bias, aligned with the broader range-bound sideway consolidation. Recent price action shows a retest of the resistance, (previous rising support)
Key resistance is located at 1.7907, a prior consolidation zone. This level will be critical in determining the next directional move.
A bearish rejection from 1.7907 could confirm the resumption of the downtrend, targeting the next support levels at 1.7720, followed by 1.7680 and 1.7643 over a longer timeframe.
Conversely, a decisive breakout and daily close above 1.7907 would invalidate the current bearish setup, shifting sentiment to bullish and potentially triggering a move towards 1.7950, then 1.7986.
Conclusion:
The short-term outlook remains bearish unless the pair breaks and holds above 1.7907. Traders should watch for price action signals around this key level to confirm direction. A rejection favours fresh downside continuation, while a breakout signals a potential trend reversal or deeper correction.
This communication is for informational purposes only and should not be viewed as any form of recommendation as to a particular course of action or as investment advice. It is not intended as an offer or solicitation for the purchase or sale of any financial instrument or as an official confirmation of any transaction. Opinions, estimates and assumptions expressed herein are made as of the date of this communication and are subject to change without notice. This communication has been prepared based upon information, including market prices, data and other information, believed to be reliable; however, Trade Nation does not warrant its completeness or accuracy. All market prices and market data contained in or attached to this communication are indicative and subject to change without notice.
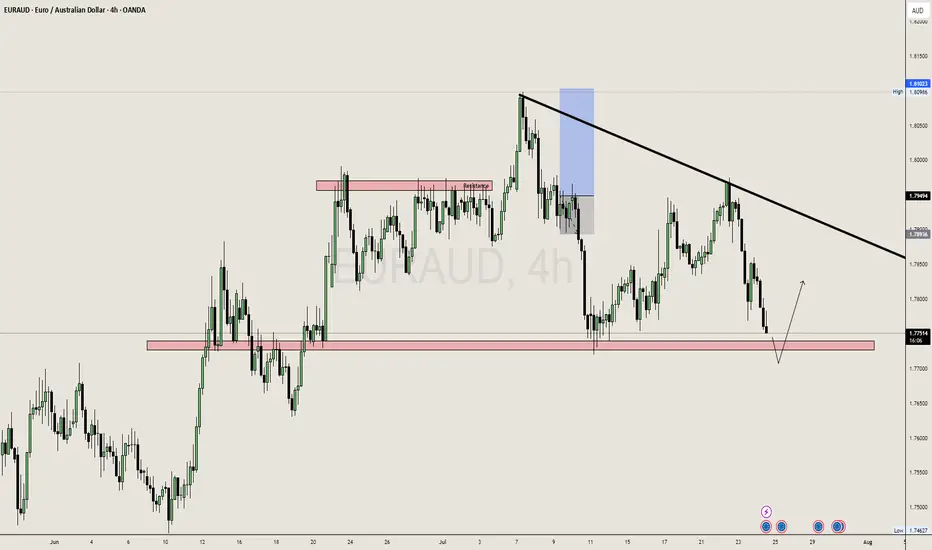
EURAUD Long - Pullback from Monthly Support - Easy MoneyOANDA:EURAUD Long Trade.
EURUSD is Bouncing Back from Monthly Support.
Note: Manage your risk yourself, its risky trade, see how much your can risk yourself on this trade.
Don't be greedy.
Use proper risk management
Looks like good trade.
Lets monitor.
Use proper risk management.
Disclaimer: only idea, not advice

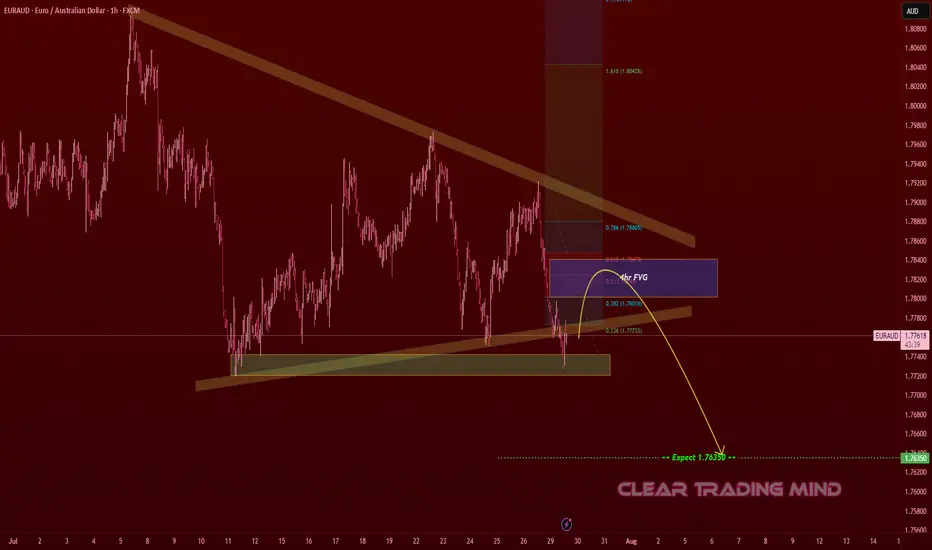
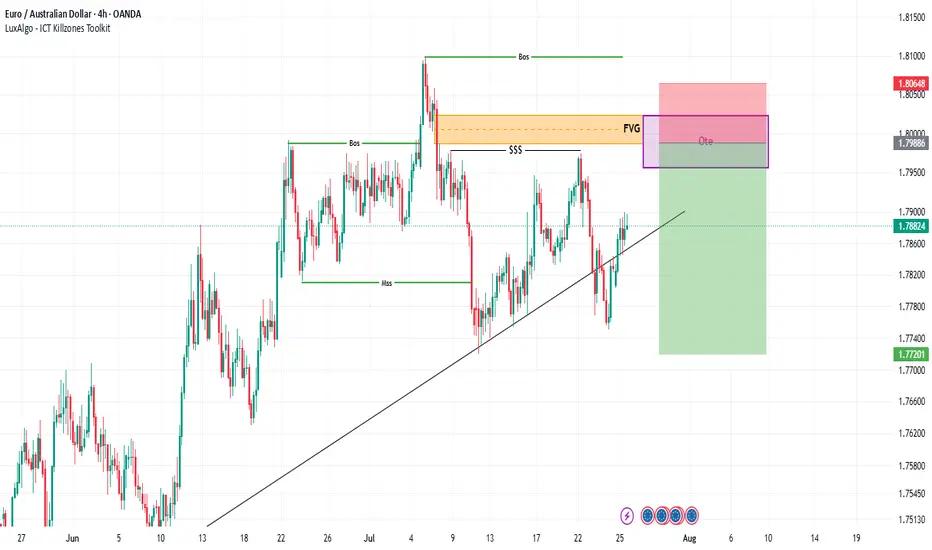
EURAUD Bearish Pullback – Short From 4hr FVG to 1.7635EURAUD – Bearish Outlook
- Key Zone: 4hr FVG (Fair Value Gap) near 1.7800 – 1.7820
- Fibonacci Levels: Retracement aligns with 0.5 – 0.618 zone, potential reaction point.
- Expected Target: 1.76350
Analysis:
1. Market shows a downward structure with lower highs and lower lows.
2. A possible pullback into the FVG zone could trigger a bearish continuation.
3. Confluence with Fibonacci levels strengthens the case for short trades targeting 1.76350.
Sell euraud Our last selling ieea already running 400+ pips
Now wait to breaks the previous lower high then sell witb confirmation

EURAUD: Bullish Move After a Trap 🇪🇺 🇦🇺
There is a high chance that EURAUD will rise from the underlined support.
A confirmed liquidity grab and a consequent bullish imbalance
provide a strong confirmation.
Goal - 1.7794
❤️Please, support my work with like, thank you!❤️

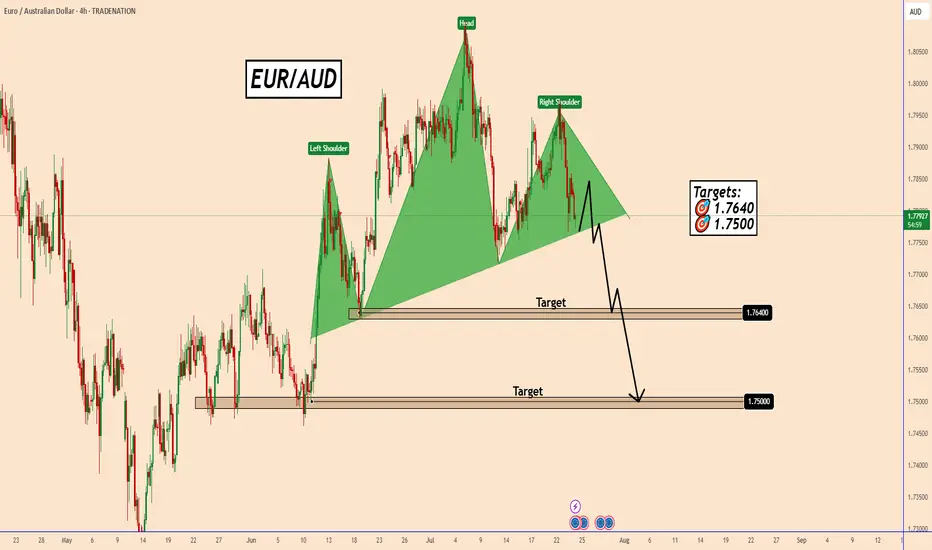
EURAUD is poised to confirm a bearish Head & Shoulders pattern.EURAUD is poised to confirm a bearish Head & Shoulders pattern.
The price could move higher today on hopes that the ECB can share some positive news on the economy and interest rates.
The European Central Bank is expected to keep interest rates unchanged, ending a seven-year streak of cuts.
If the price manages to break below the neckline of the pattern, it will open the door for further declines.
The first support zone will be found near 1.7640 and the second near 1.7500.
You may find more details in the chart!
Thank you and Good Luck!
PS: Please support with a like or comment if you find this analysis useful for your trading day
Disclosure: I am part of Trade Nation's Influencer program and receive a monthly fee for using their TradingView charts in my analysis.
Understanding Market StructureYou can follow us for more Analysis(Images and Videos) with Precise definition of the Financial Market.ENJOY!!!

EURAUD THE CURRENT PRICEACTION OF EURAUD IS WATCHED.
EU10Y=2.689%
ECB RATE 2.0%
AU10Y= 4.348%
RBA RATE =3.85%
RATE AND BOND YIELD DIFFERENTIAL FAVOR AUD .
The recent fluctuations in the EUR/AUD exchange rate are primarily driven by factors including:
Monetary Policy and Interest Rate Differentials:
Decisions and outlooks from the European Central Bank (ECB) and the Reserve Bank of Australia (RBA) strongly impact EUR/AUD. Hawkish (tightening) or dovish (easing) policy stances influence demand for each currency, affecting the exchange rate. For example, higher interest rates or hawkish tones usually strengthen a currency, while easing weakens it. Differences in inflation rates and inflation expectations also play a part, as central banks adjust rates accordingly.
Economic Indicators and Growth Outlooks:
Economic performance disparities between the Eurozone and Australia—such as GDP growth, trade balances, and industrial versus commodity exports—drive currency strength or weakness. The Eurozone’s economy is more industrial and technological, while Australia's economy is strongly commodity-driven, especially by prices of iron ore and gold. Changes in global commodity prices or demand can cause the AUD to fluctuate vs the EUR.
Commodity Prices, Especially Gold:
Since Australia is a major gold producer, AUD tends to correlate positively with gold prices. Rising gold prices support AUD strength, which may lower EUR/AUD rates, and vice versa.
Global Risk Sentiment and Geopolitical Events:
Global market sentiment—whether investors seek risk or safe-haven assets—affects both currencies. The Euro and AUD react differently to geopolitical developments and trade tensions. For instance, increased risk appetite can strengthen AUD vs EUR and vice versa depending on circumstances.
In summary, the recent EUR/AUD fluctuations reflect the interplay of ECB and RBA policies, divergent economic data between Europe and Australia, commodity price movements (notably gold), and shifting global risk sentiment.
This explains why EUR/AUD rates move as they do: when the Eurozone outlook improves or ECB signals tightening while Australian commodity prices weaken or RBA signals easing, EUR tends to strengthen against AUD, and the pair rises. Conversely, stronger Australian growth, rising commodity prices, or hawkish RBA moves can push the pair lower.
#EURAUD

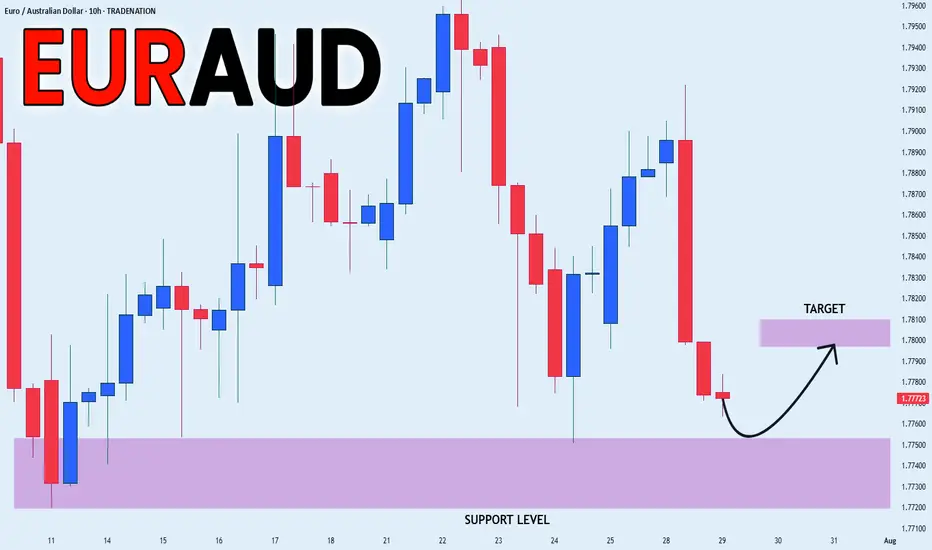
EUR_AUD LOCAL GROWTH AHEAD|LONG|
✅EUR_AUD will soon retest a key support level of 1.7750
So I think that the pair will make a rebound
And go up to retest the supply level above at 1.7800
LONG🚀
✅Like and subscribe to never miss a new idea!✅
Disclosure: I am part of Trade Nation's Influencer program and receive a monthly fee for using their TradingView charts in my analysis.
EUR/AUD Bearish Move confirmedHi Traders,
I already entered after the breakout
from the first correction but maybe if
some LTF Correction develops there is
more Opportunity to get into this Trade.

EURAUD | One Kiss from 1.7906 and I’m In – TP 140 Pips!The big picture of EURAUD is SELL possible up to 1.7750
Spot that H1 BUY range?
Inside it, there is conflict. A sneaky SELL range form inside it after rejection H4 BLUE LINE.
See that top blue line at 1.7916?
It got a gentle kiss from the H4 candle (REJECTION).
Then H1 already whispered, "a sweet breakout"!
📌LONG STORY SHORT, I'M SELL AROUND 1.7888 - 7906
If H4 comes and kisses one of the line (just a touch and wick), I’m SELLING — no more playing hard to get. 😘
Other wise, I’ll quietly cry in the corner
TP? 1.7750 — that’s a sweet 140-candlelit dinner!
WISH ME LUCK...!!!

Euraud daily timeframe
"Hello friends, focusing on EUR/AUD on the daily time frame, the price is currently in a bullish trend and appears to have completed its pullback to a critical level on the daily chart. In the 4-hour timeframe, there are indications of upward momentum.
After observing the price behavior this week, I believe that higher prices are more likely. However, it is important to note that if the price closes below the 1.7100 level on the 4-hour chart, this analysis may prove incorrect."
If you have any more details to add or need further assistance, please let me know!

EUR/AUD: Triangle Breakout Opportunity^EURAUD is currently trading at 1.7878, forming a well-defined symmetrical triangle pattern after a strong uptrend that began in early 2023. The pair has maintained a bullish structure with higher lows along a clear trendline since mid-2022, culminating in a powerful breakout in March 2025.
Technical Analysis
Triangle Formation: Since April 2025, price has consolidated in a symmetrical triangle, with converging trendlines indicating compression before the next directional move.
Support Zone: The 1.77 area has proven to be reliable support throughout June-July 2025, with multiple successful tests.
Resistance Level: The 1.80 level has capped upward movement since April, creating the upper boundary of our triangle pattern.
Momentum Indicators: The recent higher lows suggest underlying bullish pressure building within the triangle formation.
Trading Strategy
Given the overall uptrend and triangle formation, this setup offers a compelling trading opportunity:
Bullish Trade Setup
Entry: Buy at current market price (1.7878) or on a pullback to 1.7780
Stop Loss: Place below the triangle support at 1.7680
First Target: 1.8050 (triangle resistance)
Second Target: 1.8300 (measured move from triangle height)
Risk-Reward: Approximately 1:2.5 for the full move
Alternative Approach
Breakout Entry: Buy on a break above 1.8000 with a stop below 1.7780
Breakout Target: 1.8300-1.8400
Rationale
The symmetrical triangle forming at the upper range of a strong uptrend typically resolves in the direction of the prevailing trend. With ^EURAUD showing resilience at support levels and maintaining its position above the long-term trendline, the probability favors an upside resolution.
The March 2025 breakout demonstrated significant bullish momentum, and the current consolidation appears to be a pause rather than a reversal. The multiple tests of support at 1.77 without breaking lower further strengthens the bullish case.
Key Levels to Watch
Breakout Confirmation: Daily close above 1.8000
Support Breakdown Alert: Daily close below 1.7700
Major Support: Long-term trendline around 1.7000
Upside Potential: Previous high at 1.8550 (April 2025)
^EURAUD presents a classic triangle consolidation within an uptrend, offering a favorable risk-reward opportunity. The technical structure suggests accumulation rather than distribution, with price likely to resolve higher in alignment with the longer-term bullish trend.
Traders should monitor the 1.80 resistance level closely, as a decisive break above this level could trigger a significant move higher, potentially targeting the April 2025 highs.

bearish ideaThe trend is bearish after the structure break. I’m waiting for the price to return to the imbalance on the 4-hour timeframe, and I will not sell until liquidity is swept above and there is a reaction to the imbalance.
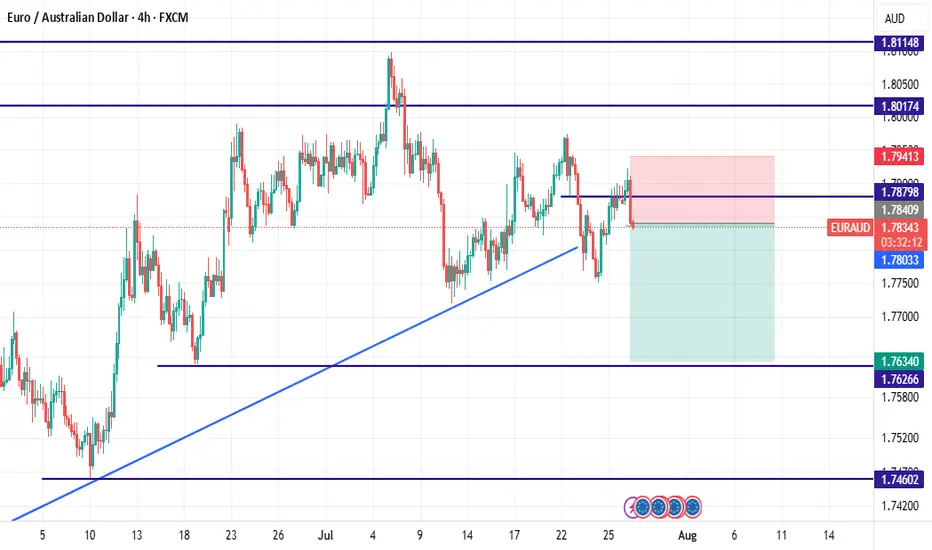
EURAUD SELL!!!targeting a supply zone on the 4hr time frame
Entry : 1.79248
TP : 1.77204
SL : 1.79788

EURAUD Approaching SupportWe can expect a buy side move from the support till the trend line.
EA is Sideways in Daily we can plan the buy till the resistance zone/ trend line.