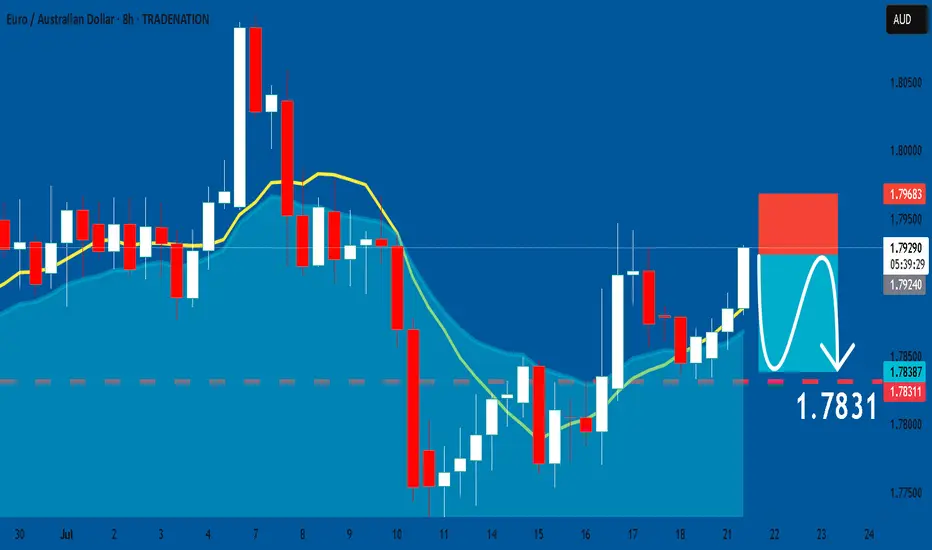
EURAUD: Short Signal Explained
EURAUD
- Classic bearish pattern
- Our team expects retracement
SUGGESTED TRADE:
Swing Trade
Sell EURAUD
Entry - 1.7924
Stop - 1.7968
Take - 1.7831
Our Risk - 1%
Start protection of your profits from lower levels
Disclosure: I am part of Trade Nation's Influencer program and receive a monthly fee for using their TradingView charts in my analysis.
❤️ Please, support our work with like & comment! ❤️
AUDEUR trade ideas
euraud long tradein my opinion this is a good trade with a good r/r
hope hit the tp
consider this is my trade not your trade and i just like to share my trades with world

The 4 Pillars of PRICE ACTION - Explained!!!!!All the information you need to find a high probability trade are in front of you on the charts so build your trading decisions on 'the facts' of the chart NOT what you think or what you want to happen or even what you heard will happen. If you have enough facts telling you to trade in a certain direction and therefore enough confluence to take a trade, then this is how you will gain consistency in you trading and build confidence. Check out my trade idea!!
www.tradingview.com

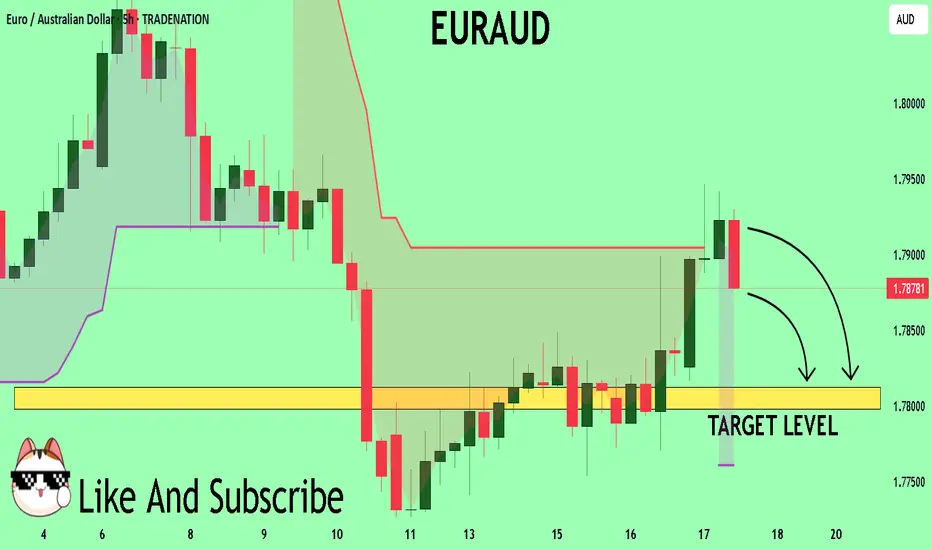
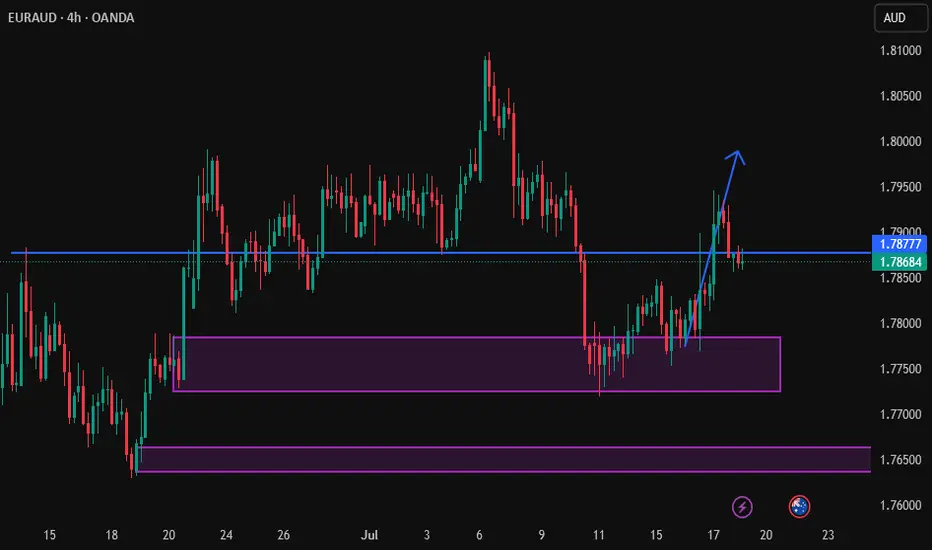
Sell EURAUDEURAUD sell scenario considering a bearish flag pattern. Sell towards 1,78333 but stop at 1,78777.

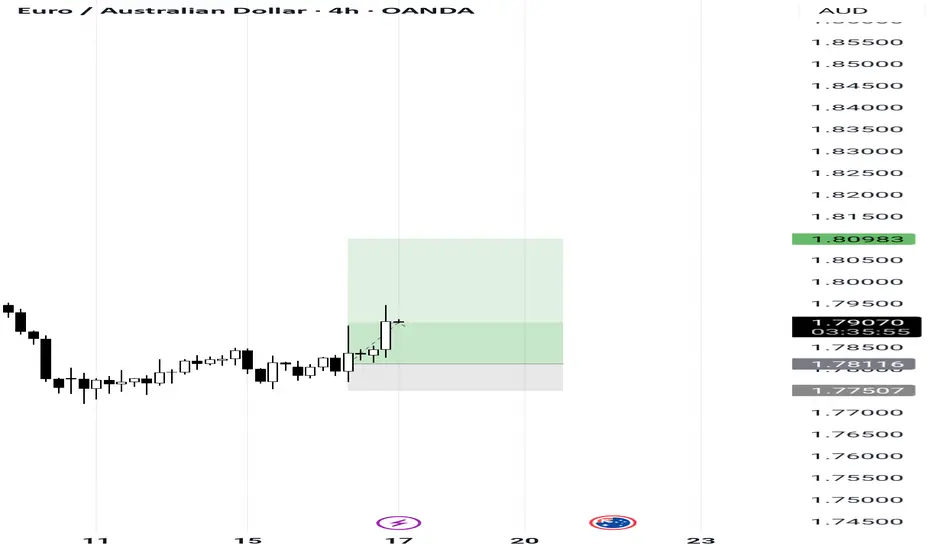
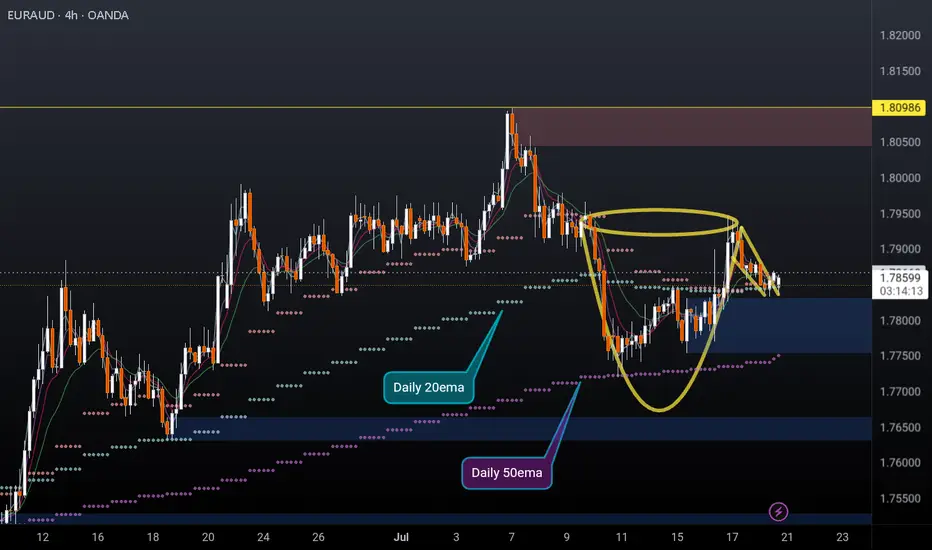
EURAUD 4H cup and handleEURAUD 4H cup and handle formed and possibly breaking out to the upside. Price recently found support off the daily 50ema (overlayed on this 4h chart) and is holding above the daily 10 & 20EMAs (overlayed).
I'm a cat not a financial advisor.
EUR_AUD WILL GROW|LONG|
✅EUR_AUD is trading in an uptrend
With the pair set to retest
The rising support line
From where I think the growth will continue
LONG🚀
✅Like and subscribe to never miss a new idea!✅
Disclosure: I am part of Trade Nation's Influencer program and receive a monthly fee for using their TradingView charts in my analysis.

Euraud buy buy buy nowEuro is in a clear uptrend with ozzie dollar and pulled back just about enough now, we are now back in buy territory, broke through pivot point pulled back to pivot point showing nice spi,eon support zone now at 1.78598 zone buy here tp at 1.79538

EUR-AUD Strong Uptrend! Buy!
Hello, Traders!
EUR-AUD is trading along
The rising support line in a
Strong uptrend so we we are
Bullish biased and as the pair
Is going down to retest the
Support we will be expecting
A rebound and a move up
Buy!
Comment and subscribe to help us grow!
Check out other forecasts below too!
Disclosure: I am part of Trade Nation's Influencer program and receive a monthly fee for using their TradingView charts in my analysis.

EURAUD Buyers In Panic! SELL!
My dear friends,
Please, find my technical outlook for EURAUD below:
The price is coiling around a solid key level - 1.7893
Bias - Bearish
Technical Indicators: Pivot Points Low anticipates a potential price reversal.
Super trend shows a clear sell, giving a perfect indicators' convergence.
Goal - 1.7812
About Used Indicators:
The pivot point itself is simply the average of the high, low and closing prices from the previous trading day.
Disclosure: I am part of Trade Nation's Influencer program and receive a monthly fee for using their TradingView charts in my analysis.
———————————
WISH YOU ALL LUCK
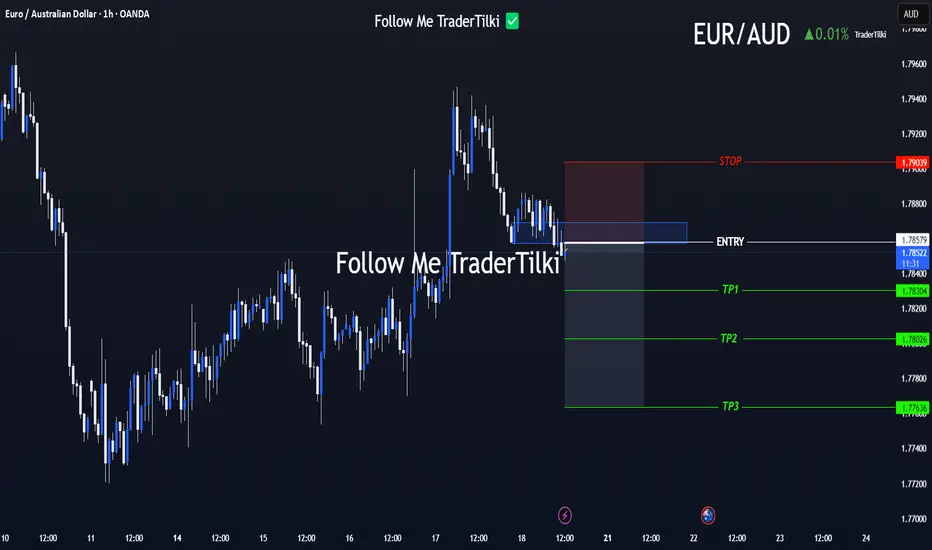
FX Setup of the Day: EURAUD SELL ZONEHey traders 👋
📌 SELL / EURAUD – Technical Breakdown
🟢 Entry: 1.78579
🎯 Target 1: 1.78304
🎯 Target 2: 1.78026
🎯 Target 3: 1.77636
🔴 Stop Loss: 1.79039
📈 Risk/Reward Ratio: 2.00
I’ve carefully validated these levels and crafted a clean, focused analysis for you.
Every like seriously fuels my drive to produce more top-tier content 📈
Your support genuinely means a lot to me.
Thanks from the heart to everyone showing love 💙
🎯 Clear targets, solid strategy.
🤝 Let’s move forward with logic and discipline.
EURAUD → Correction for accumulation before growthFX:EURAUD reaches the zone of interest during a correction and forms a false breakdown of local support. Traders can switch to the buy side to support the trend.
Against the backdrop of a global bullish trend and a correction in the euro, the currency pair is following this movement, the essence of which is to consolidate funds for further growth. Liquidation is forming in relation to the liquidity zones of 1.785, 1.78, and 1.773, and the market imbalance is changing. The current movement is bringing the price to the zone of interest: the liquidity area of 1.773 and the order block. The capture of liquidity relative to 1.773 leads to the formation of a false breakdown and a pullback to the area of interest for buyers. Accordingly, price consolidation above 1.776 and 0.7 Fibonacci could support the main trend and allow the price to strengthen.
Support levels: 1.776, 1.773, 1.763
Resistance levels: 1.786, 1.795
The euro clearly demonstrates an upward trend, the structure of which has not been broken during the correction. Correction is a perfectly healthy movement within a trend, allowing positions to be opened at more favorable prices. If the bulls hold their defense above 1.776, momentum towards the specified targets may form.
Best regards, R. Linda!

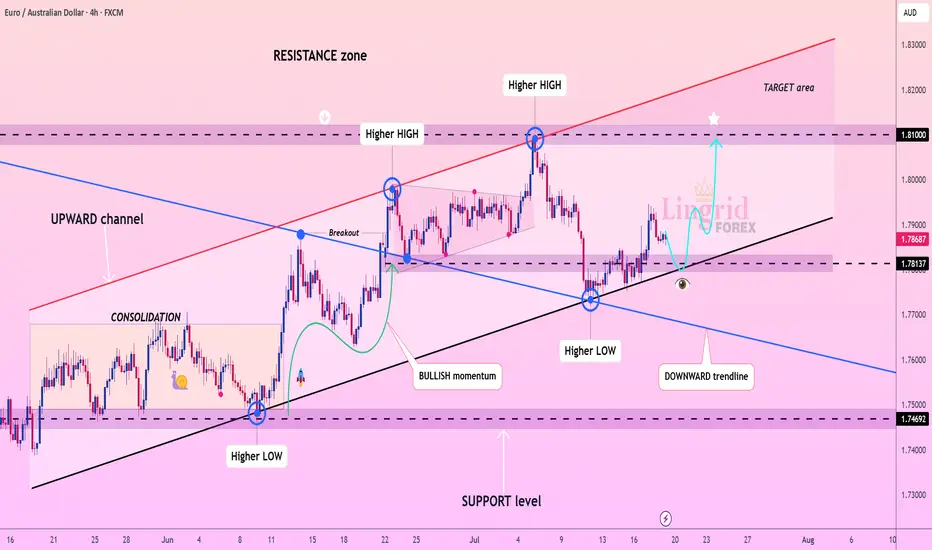
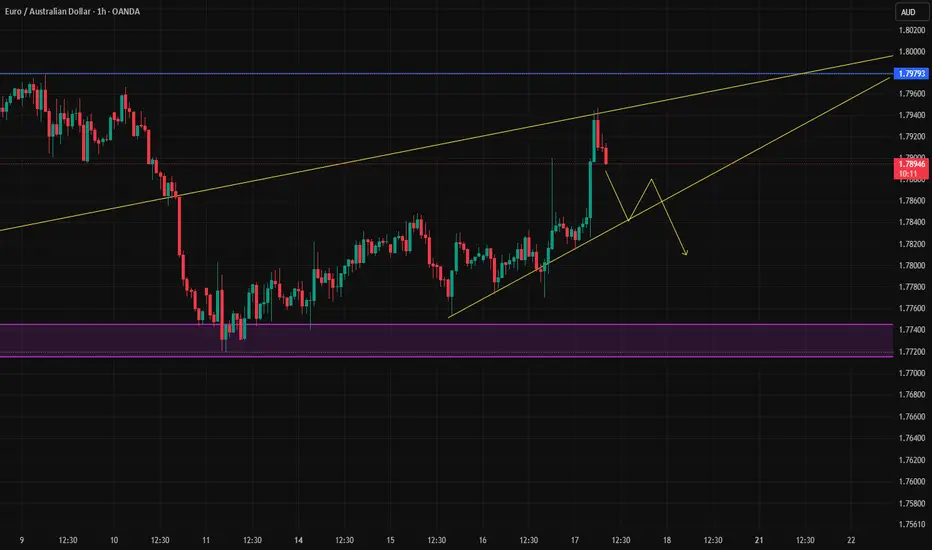
Lingrid | EURAUD Potential Retest of the Key LevelFX:EURAUD is holding firmly above the rising trendline after a successful retest of the support zone at 1.7813. The price has formed consecutive higher lows and remains within a well-defined upward channel, indicating continued bullish structure. A small corrective pullback is expected before a renewed rally toward the 1.8100 resistance level. Momentum is building for a potential breakout continuation toward the upper boundary of the channel.
📉 Key Levels
Buy trigger: Bounce from 1.7813 and reclaim of 1.7900
Buy zone: 1.7820–1.7880
Target: 1.8100
Invalidation: Breakdown below 1.7780 and support trendline
💡 Risks
Failure to hold above the current higher low
False breakout followed by bearish rejection from the mid-range
Weak momentum due to macroeconomic uncertainty
If this idea resonates with you or you have your own opinion, traders, hit the comments. I’m excited to read your thoughts!
EURAUDThe price just tapped into a valid order block.
This suggests a potential long (buy) opportunity.
We may see bullish momentum from this zone.
Watch for confirmation like bullish engulfing or BOS or CHOCH.
Place stop loss just below the order block.
Target the next resistance or liquidity zone.
Wait for entry confirmation on lower timeframe.
EURNZDThis is a chart of EURNZD on the 4H timeframe. Here's what it shows and what you can post:
Analysis:
- CHoCH (Change of Character) shows a shift from bullish to bearish structure.
- Price retested the supply zone after CHoCH.
- Now it's reacting downwards from that area.
- Two Take Profit zones (TP1 and TP2) are clearly marked as price targets.
What to do:
- Look for sell entries below the retest zone.
- Set your targets at TP1 and TP2.
- Confirm with lower timeframe structure or candlestick patterns before entering.
"EURNZD analysis — Bearish bias confirmed after a clear CHoCH and retest of the supply zone. Watching for sell setups down to TP1 and TP2. Patience and precision is key. 📉🔥 #ForexTrading #SmartMoney #EURNZD #PriceAction"

EURNZDThis is a chart of EURNZD on the 4H timeframe. Here's what it shows and what you can post:
Analysis:
- CHoCH (Change of Character) shows a shift from bullish to bearish structure.
- Price retested the supply zone after CHoCH.
- Now it's reacting downwards from that area.
- Two Take Profit zones (TP1 and TP2) are clearly marked as price targets.
What to do:
- Look for sell entries below the retest zone.
- Set your targets at TP1 and TP2.
- Confirm with lower timeframe structure or candlestick patterns before entering.

EURAUD BUY OPPORTUNITY Buying from the current market gives an edge to capitalise on the bullish trend that’s developing after a major pullback that happed in the H4 timeframe.
Our target is at 1.79872

EURAUD Bullish Bias!
HI,Traders !
#EURAUD keeps trading
In an uptrend along the
Rising support line and
We are already seeing a
Bullish rebound so we are
Bullish biased and we will
Be expecting a further
Bullish move up !
Comment and subscribe to help us grow !

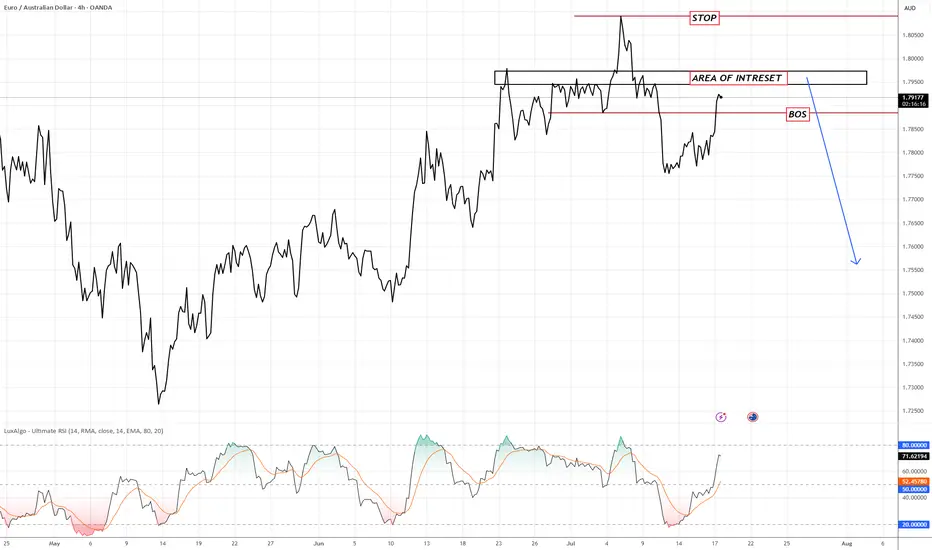
EURAUDWe're approaching a high-probability area of interest just below 1.7950. Price recently created a Break of Structure (BOS) at 1.7870 and is now retesting that broken structure zone.
📌 Key Levels:
Entry Zone (AOI): 1.7920 – 1.7950
Stop Loss: 1.8020 (above recent highs)
Target: 1.7665 – swing low support
💡 Expecting a rejection from the supply zone and continuation of the bearish move.
Confluence:
BOS confirmation
RSI overbought
Weak Euro sentiment fundamentally vs AUD strength from commodities
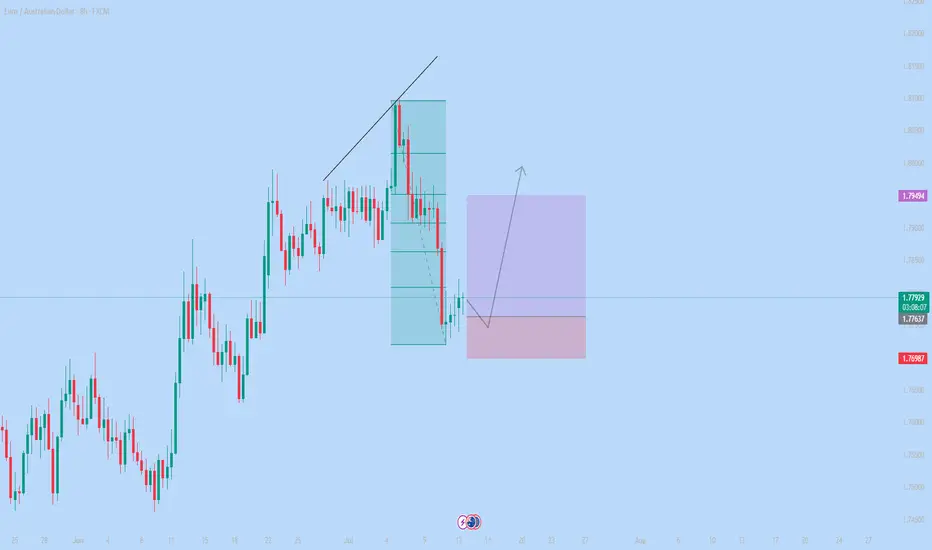
#009: EUR/AUD Long Investment Opportunity
We placed a buy limit order at 1,776, waiting for a bearish spike that would allow us to enter alongside the institutions, not against them.
Why this entry?
🔻 We're waiting for a false breakout at 1,776, a key level where big players are accumulating liquidity with technical stop hunts.
🔐 The SL is below the levels where banking systems have protective orders for the future.
📊 Retailers are still heavily short and aren't exiting, confirming that the upside movement hasn't started yet.
📈 Open interest shows anticipation of an imminent breakout, with progressive loading by large players.
⏳ We're staying out now to avoid being victims of the retracement, but ready to enter on the institutional bearish spike.
A violent expansion toward 1.79, with a directional candlestick that will start as soon as the retail cleanup below 1.776 is completed.
The trade has all the hallmarks of a perfect institutional entry: early positioning, patience, and a defensive stop.
MarketBreakdown | EURAUD, GBPJPY, WTI CRUDE OIL, SILVER
Here are the updates & outlook for multiple instruments in my watch list.
1️⃣ #EURAUD daily time frame 🇪🇺🇦🇺
The market is trading in a bullish trend.
The price is steadily growing within a rising parallel channel.
A recent test of its support triggered a strong bullish reaction.
I think that a rise may continue at least to a current high - 1.8035
2️⃣ #GBPJPY daily time frame 🇬🇧🇯🇵
The market is consolidating within a narrow horizontal
parallel channel.
Consider consolidation, trading within its boundaries.
The next bullish wave will be confirmed with a breakout and a
daily candle close above its resistance.
3️⃣ CRUDE OIL #WTI daily time frame 🛢️
The market remains weak and consolidation continues.
I see a wide horizontal range where the price is now stuck.
I think that we may see a pullback from its support.
4️⃣ #SILVER #XAGUSD daily time frame 🪙
The market is retracing after a formation of a new higher high.
I see a strong demand zone ahead: it is based on a rising trend line
and a recently broken horizontal resistance.
The next trend following movement will most likely initiate from there.
Do you agree with my market breakdown?
❤️Please, support my work with like, thank you!❤️
I am part of Trade Nation's Influencer program and receive a monthly fee for using their TradingView charts in my analysis.

If confirmed, this could be a strong trigger to enter shortIf the euro is indeed set to weaken — as we anticipate based on the current signs of trend exhaustion — this could be a solid trigger for a short position.
However, if the breakout fails to confirm, it may turn out to be a fakeout, potentially leading to a bullish reversal instead
EURAUD buy ideaAs expected now price moving in our favoured direction
Took some partials and move stops to breakeven 🤝