AUDGBP trade ideas
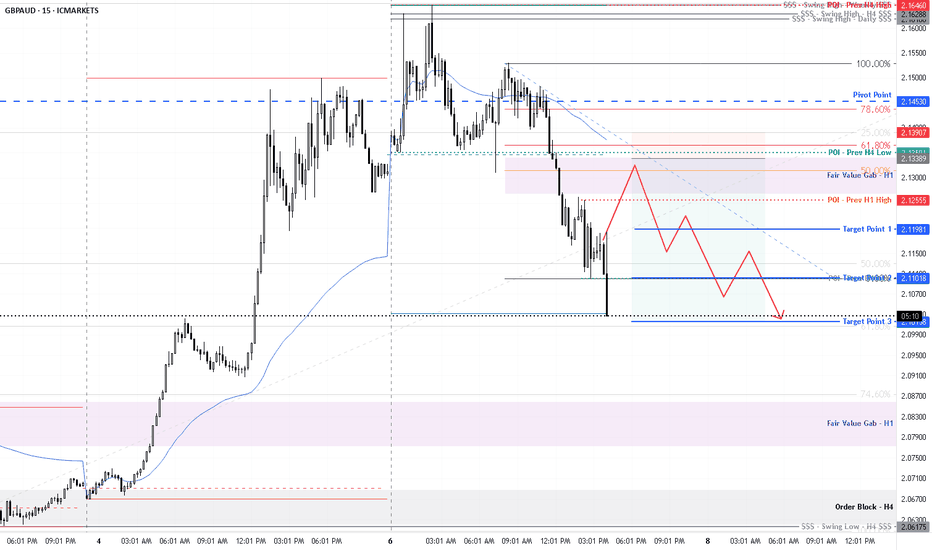
GBPAUD INTRADAY overbought consolidation supported at 2.1100GBPAUD retains a bullish outlook, driven by the prevailing uptrend. The latest price movement suggests a corrective pullback toward a previous consolidation zone, offering potential for trend continuation.
Key Support Level: 2.1100 – prior consolidation area and immediate decision point for bulls
Upside Targets:
2.1550 – initial resistance
2.1720 and 2.2000 – medium to longer-term bullish targets
A bullish bounce from 2.1100 would signal resumption of the upward trend, targeting the above resistance levels.
On the flip side, a confirmed break and daily close below 2.1100 would invalidate the bullish structure, setting up a deeper pullback toward 2.0860, with additional support at 2.0690 and 2.0580.
Conclusion
GBPAUD remains bullish above 2.1100. A bounce from this level favors upside continuation. A daily close below 2.1100 would shift momentum bearish, opening the path to deeper retracement targets.
This communication is for informational purposes only and should not be viewed as any form of recommendation as to a particular course of action or as investment advice. It is not intended as an offer or solicitation for the purchase or sale of any financial instrument or as an official confirmation of any transaction. Opinions, estimates and assumptions expressed herein are made as of the date of this communication and are subject to change without notice. This communication has been prepared based upon information, including market prices, data and other information, believed to be reliable; however, Trade Nation does not warrant its completeness or accuracy. All market prices and market data contained in or attached to this communication are indicative and subject to change without notice.
This 5 Step System Boosts The Rocket Booster StrategyThis 5 Step System Boosts The Rocket Booster Strategy
1. DAY- Strong Buy/Sell
2. 4 HOUR- Strong Buy/Sell
3. 2 HOUR- Strong Buy/Sell
4. 1 HOUR- Strong Buy/Sell
5. 30 MINUTES- Strong Buy/Sell
In this video we dive into the best way to trade forex
now even though it looks easy at a glance you need
to be careful.
Thats why i made this video for you
because i want to show you
how exactly the strategy works
Trust the process but always learn how to
verify this strategy using technical analysis
and thats the power of this video inside
it am showing you how to confirm the entry signal
using technical analysis
Watch this video to learn more.
Rocket boost this content to learn more
Disclaimer:Trading is risky please learn risk
management and profit taking strategies
and feel free to use a simulation trading account.
GBP AUD Long on the Back of Tariffs and Hammered ChinaI've been long the GBP AUD for a while and its been working well. I will basically strip all TA right down now and say just buy a break above or a break below (weakness). Get a good stop somewhere out of the way, minimise your risk and hope for the best.
The range may widen in the short term but ultimately the outlook now for the GBP AUD is very much up.
Go long and prosper!!
GBPAUD Massive Short! SELL!
My dear friends,
GBPAUD looks like it will make a good move, and here are the details:
The market is trading on 2.0922 pivot level.
Bias - Bearish
Technical Indicators: Supper Trend generates a clear short signal while Pivot Point HL is currently determining the overall Bearish trend of the market.
Goal - 2.0761
About Used Indicators:
Pivot points are a great way to identify areas of support and resistance, but they work best when combined with other kinds of technical analysis
Disclosure: I am part of Trade Nation's Influencer program and receive a monthly fee for using their TradingView charts in my analysis.
———————————
WISH YOU ALL LUCK
GBPAUD Analysis: Bullish Momentum Ahead with EASY Trading AI SigAnalyzing GBPAUD using our EASY Trading AI strategy reveals a clear Buying opportunity at 2.06408. Current algorithmic indicators confirm bullish momentum gaining strength, supporting a projected rise towards our target at 2.07540667. The structured setup, derived from advanced trend recognition and volatility analysis in EASY Trading AI, positions Stop Loss reliably at 2.05014667 to mitigate risk. Precise risk-reward alignment and steadily rising volume validate this bullish expectation on GBPAUD.
GBPAUD - Already Over-Bought!Hello TradingView Family / Fellow Traders. This is Richard, also known as theSignalyst.
📈GBPAUD has been bullish trading within the rising channels in orange and red.
Currently, GBPAUD is retesting the upper bound of the channels.
Moreover, the $2.085 - $2.1 is a strong resistance zone.
🏹 Thus, the highlighted red circle is a strong area to look for sell setups as it is the intersection of the upper trendlines and green resistance zone.
📚 As per my trading style:
As #GBPAUD approaches the red circle zone, I will be looking for bearish reversal setups (like a double top pattern, trendline break , and so on...)
📚 Always follow your trading plan regarding entry, risk management, and trade management.
Good luck!
All Strategies Are Good; If Managed Properly!
~Rich
Disclosure: I am part of Trade Nation's Influencer program and receive a monthly fee for using their TradingView charts in my analysis.
GBPAUD - One More Leg!Hello TradingView Family / Fellow Traders. This is Richard, also known as theSignalyst.
📈GBPAUD has been overall bullish trading within the rising channel marked in blue.
Moreover, it is retesting a strong structure.
🏹 Thus, the highlighted blue circle is a strong area to look for buy setups as it is the intersection of structure and lower blue trendline acting as a non-horizontal support.
📚 As per my trading style:
As #GBPAUD approaches the blue circle zone, I will be looking for bullish reversal setups (like a double bottom pattern, trendline break , and so on...)
📚 Always follow your trading plan regarding entry, risk management, and trade management.
Good luck!
All Strategies Are Good; If Managed Properly!
~Rich
Disclosure: I am part of Trade Nation's Influencer program and receive a monthly fee for using their TradingView charts in my analysis.
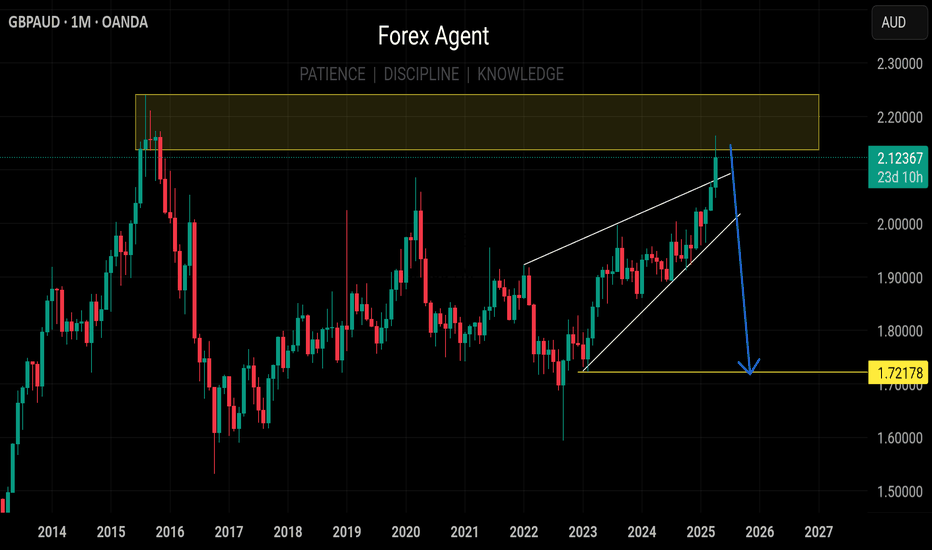
GBP/AUD Prepares for a major correction? The current technical situation of the GBP/AUD peaks the eye of the bears on the weekly chart
From a technical perspective we have 2 factors that that provide interest to the sellers
- a full Elliot wave sequence is in the process of completion with the 5th wave at terminal status, even tough this might move higher, but...
-i believe this is potential tipping point , considering the price action hasn't visited this area since march 2020 (and considering the amount of rejection it faced back then, there is a chance this might happen again
If the correction plays out we could possibly see some down moves all the way to psychological level of 2.000
Even if your not a weekly trader, keeping this information in mind might help with future trades on the pair on the down side , just remember to take risks into consideration
- Always make your own analysis before taking a financial decision
- Risk/Reward ratio is your friend
This is not financial advice !
GBP/AUD BEST PLACE TO BUY FROM|LONG
Hello, Friends!
It makes sense for us to go long on GBP/AUD right now from the support line below with the target of 2.061 because of the confluence of the two strong factors which are the general uptrend on the previous 1W candle and the oversold situation on the lower TF determined by it’s proximity to the lower BB band.
Disclosure: I am part of Trade Nation's Influencer program and receive a monthly fee for using their TradingView charts in my analysis.
✅LIKE AND COMMENT MY IDEAS✅
gbpaud sell signal. Don't forget about stop-loss.
Write in the comments all your questions and instruments analysis of which you want to see.
Friends, push the like button, write a comment, and share with your mates - that would be the best THANK YOU.
P.S. I personally will open entry if the price will show it according to my strategy.
Always make your analysis before a trade
GBPAUD analysis elliot. Don't forget about stop-loss.
Write in the comments all your questions and instruments analysis of which you want to see.
Friends, push the like button, write a comment, and share with your mates - that would be the best THANK YOU.
P.S. I personally will open entry if the price will show it according to my strategy.
Always make your analysis before a trade
GBPAUD BUY TRADE PLAN🔥 GBP/AUD TRADE PLAN
📅 Date: April 2, 2025
🔖 Plan Type
Main Swing Plan
📈 Bias & Trade Type
Bullish Reversal Setup – Long-term trend continuation after pullback
🔰 Confidence
⭐⭐⭐⭐ (80%)
Reasons:
– D1 bullish BOS structure
– H4 OB + Liquidity sweep alignment
– Rejection wicks and EMA defense
– AUD weakness and GBP relative strength
– Macro sentiment moderately Risk-On
📌 Status
✅ Waiting for first tap into zone
(Zone not touched – fresh institutional entry opportunity)
📍 Entry Zones
Primary Buy Zone: 2.0490 – 2.0515
(H4 OB + FVG + EQ lows liquidity sweep)
Secondary Buy Zone: 2.0445 – 2.0465
(Deeper liquidity + refined OB with inducement)
❗ Stop Loss
SL: 2.0390
(Under all key structural lows and invalidation wick)
🎯 Take Profits
🥉 TP1: 2.0625 – Partials & SL to BE
🥈 TP2: 2.0700 – Swing liquidity pocket
🏆 TP3: 2.0785 – D1 premium zone target
📏 Risk:Reward
Minimum R:R = 1:3.4
Optimized for swing precision setups
🧠 MANAGEMENT STRATEGY
– Enter only after confirmation in zone
– Move SL to BE after TP1
– Scale partials at TP2
– Let final position run with trailing SL toward TP3
– If missed: wait for rejection candle + consider refined re-entry
⚠️ Confirmation Criteria
– H1 bullish engulfing or pin bar in zone
– MACD or RSI momentum shift on M30+
– Volume spike near OB or FVG
– Rejection during London or NY open for best fill
⏳ Trade Validity
Valid for 1–3 days (H4 swing bias)
❌ Invalidation if H4 closes below 2.0390
🌐 Fundamental Alignment
✅ GBP remains resilient on wage/inflation expectations
✅ AUD pressured by weak commodities + dovish RBA
✅ Risk-On tilt mildly favors GBP flows
📋 Final Summary
We are looking to buy GBP/AUD from 2.0490–2.0515 zone, with deeper buffer at 2.0445–2.0465. Structure, liquidity, OB + momentum all align for a clean bullish swing continuation. Only execute after proper zone confirmation. Smart Money model fully supports this setup.


