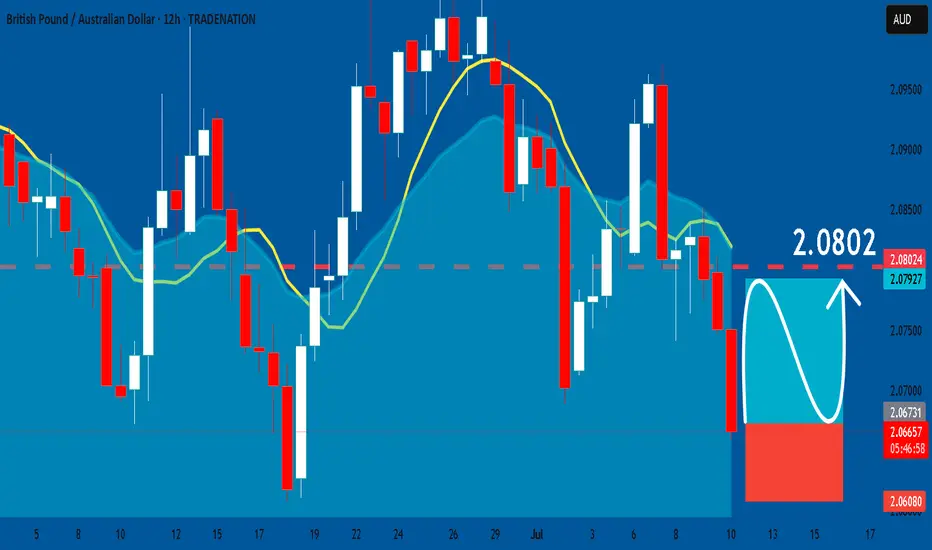
GBPAUD: Long Trade Explained
GBPAUD
- Classic bullish formation
- Our team expects growth
SUGGESTED TRADE:
Swing Trade
Buy GBPAUD
Entry Level - 2.0672
Sl - 2.0608
Tp - 2.0802
Our Risk - 1%
Start protection of your profits from lower levels
Disclosure: I am part of Trade Nation's Influencer program and receive a monthly fee for using their TradingView charts in my analysis.
❤️ Please, support our work with like & comment! ❤️
AUDGBP trade ideas

GBPAUD Pre-Market Analysis📉 GBPAUD Pre-Market Analysis – Weekly Outlook
Date: July 13, 2025
Session: Pre-London Open
Analyst: Papalui | Sub Saharan Technicals
🕵️♂️ Macro Outlook
The British Pound / Australian Dollar (GBPAUD) is currently showing signs of trend exhaustion after reaching major highs around the 2.14932 zone (Marked MHH – Most Recent Higher High). A strong bearish reaction is emerging from this area, suggesting potential for long-term downside retracement or even a reversal.
🔍 Technical Structure Breakdown (1W)
MHH (Major Higher High): 2.14932
WHH (Weekly Higher High): 2.06088
Current Price: 2.05049
Fib 50% Level: Aligned around recent resistance and acting as a pivot zone.
BOS (Break of Structure): Occurred in early 2022, later invalidated by strong bullish rally.
MLL (Major Lower Low Target Zone): Projected zone around 1.59109 - 1.57752
📉 Bearish Scenario: Reversal Play
🔽 Bias: Bearish Reversal
Context: Price has formed a new high but is rejecting near the 50% Fibonacci retracement and supply zone.
Plan: Watch for lower timeframe confirmations (e.g., D1 or H4 structure breaks) below 2.04859 to initiate short positions.
Target Zones:
TP1: 1.86584
TP2: 1.81327
TP3: 1.59109 – aligning with weekly demand and structural lows
🔧 Invalidation: A sustained weekly close above 2.14932 would invalidate this bearish scenario and signal bullish continuation.
🔁 Trade Management Zones
Zone Type Action
2.06088 - 2.14932 Supply/Resistance Monitor for rejections or confirmations of reversal
1.86584 - 1.81327 Intermediate Support Partial TP or structure reassessment
1.59109 Major Demand Full TP / Trend reversal opportunity
🧠 Sentiment & Strategy
This pair has rallied over the past year, but the bearish impulse from the recent high suggests large players may be unloading positions. With key Fibonacci confluence and price action showing weakness, the current zone is a strong sell interest region. Traders should:
Stay alert for weekly or daily lower lows
Use smaller timeframes to refine entries
Avoid premature entries before price confirms lower timeframe structure breaks
📌 Summary
Bias Key Resistance POI Bearish Target
Bearish 2.14932 2.04859 1.59109
Risk Disclosure:
All trading involves risk. This analysis is for educational purposes only and should not be taken as financial advice. Always manage risk appropriately.

GBPAUD Technical & Order Flow AnalysisOur analysis is based on a multi-timeframe top-down approach and fundamental analysis.
Based on our assessment, the price is expected to return to the monthly level.
DISCLAIMER: This analysis may change at any time without notice and is solely intended to assist traders in making independent investment decisions. Please note that this is a prediction, and I have no obligation to act on it, nor should you.
Please support our analysis with a boost or comment!

GBPAUD Will Move Higher! Buy!
Please, check our technical outlook for GBPAUD.
Time Frame: 1D
Current Trend: Bullish
Sentiment: Oversold (based on 7-period RSI)
Forecast: Bullish
The price is testing a key support 2.052.
Current market trend & oversold RSI makes me think that buyers will push the price. I will anticipate a bullish movement at least to 2.082 level.
P.S
We determine oversold/overbought condition with RSI indicator.
When it drops below 30 - the market is considered to be oversold.
When it bounces above 70 - the market is considered to be overbought.
Disclosure: I am part of Trade Nation's Influencer program and receive a monthly fee for using their TradingView charts in my analysis.
Like and subscribe and comment my ideas if you enjoy them!

GBP/AUD: Familiar support holds as global growth fears biteThe bearish unwind in GBP/AUD stalled in familiar territory, bouncing from 2.0500 in Asian trade, continuing the pattern seen since April when Donald Trump first unveiled reciprocal tariff rates on U.S. trading partners. Now, like then, the bounce likely reflects concern about the outlook for the global economy following the unveiling of 30% tariff rates on E.U. imports entering the United States from August 1. The headline-driven nature of the move overrides the deeply bearish message coming from momentum indicators like RSI (14) and MACD.
If the pair were to move towards 2.0500 again, it would create a decent long setup where positions could be established above the level with a stop beneath for protection. 2.0600 and 2.0700 screen as possible targets, although the most appealing target would be 2.0800 from a risk-reward perspective—that level has seen plenty of work either side of it over recent months and has the 50-day moving average located just above.
If the pair were to reverse back through 2.0500 and close there, the bullish setup would be invalidated, opening the door for bearish trades to be set targeting support at 2.0300.
Good luck!
DS

GBPAUD Bullish Set-upAfter price formed Accumulation Schematic 2, it entered mark-up phase. Now, correction is approaching the 1h demand level exactly aligning with OTE level.

GBPAUD previous support now resistance at 2.0660The GBPAUD pair is currently trading with a bearish bias, aligned with the broader downward trend. Recent price action shows a retest of the previous support zone, suggesting a temporary relief rally within the downtrend.
Key resistance is located at 2.0660, a prior consolidation zone. This level will be critical in determining the next directional move.
A bearish rejection from 2.0660 could confirm the resumption of the downtrend, targeting the next support levels at 2.0480, followed by 2.0410 and 2.0350 over a longer timeframe.
Conversely, a decisive breakout and daily close above 2.0660 would invalidate the current bearish setup, shifting sentiment to bullish and potentially triggering a move towards 2.0710, then 2.0750.
Conclusion:
The short-term outlook remains bearish unless the pair breaks and holds above 2.0660. Traders should watch for price action signals around this key level to confirm direction. A rejection favours fresh downside continuation, while a breakout signals a potential trend reversal or deeper correction.
This communication is for informational purposes only and should not be viewed as any form of recommendation as to a particular course of action or as investment advice. It is not intended as an offer or solicitation for the purchase or sale of any financial instrument or as an official confirmation of any transaction. Opinions, estimates and assumptions expressed herein are made as of the date of this communication and are subject to change without notice. This communication has been prepared based upon information, including market prices, data and other information, believed to be reliable; however, Trade Nation does not warrant its completeness or accuracy. All market prices and market data contained in or attached to this communication are indicative and subject to change without notice.

GBPAUD SHORTMarket structure bearish on HTFs DH
Entry at both Daily and Weekly Rejection
Weekly Rejection at AOi
Daily Rejection At AOi
Previous Structure point Daily
Around Psychological Level 2.09000
H4 Candlestick rejection
Rejection from Previous structure
Levels 4.22
Entry 95%
REMEMBER : Trading is a Game Of Probability
: Manage Your Risk
: Be Patient
: Every Moment Is Unique
: Rinse, Wash, Repeat!
: Christ is King.

GBPAUD Buy opportunity! It is time to buy GBPAUD . Nice trendline support and rejection and bounced back from a strong support area as well. 1:2 risk rewards. You can take first tp @ 1:1 position and last one is @1:2. do not risk more than 1% from the account.

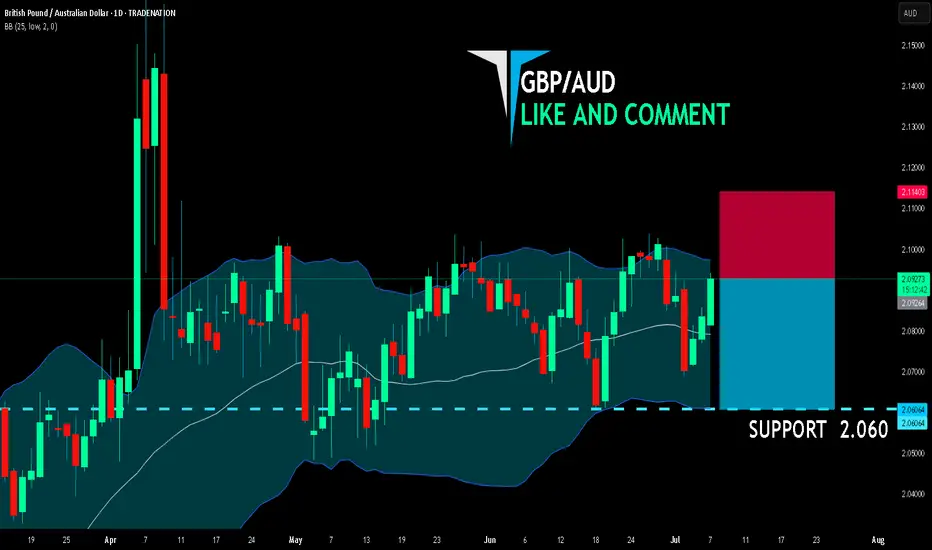
GBP/AUD SHORT FROM RESISTANCE
GBP/AUD SIGNAL
Trade Direction: short
Entry Level: 2.098
Target Level: 2.062
Stop Loss: 2.122
RISK PROFILE
Risk level: medium
Suggested risk: 1%
Timeframe: 1D
Disclosure: I am part of Trade Nation's Influencer program and receive a monthly fee for using their TradingView charts in my analysis.
✅LIKE AND COMMENT MY IDEAS✅

GBP/AUD BEARS ARE STRONG HERE|SHORT
GBP/AUD SIGNAL
Trade Direction: short
Entry Level: 2.092
Target Level: 2.060
Stop Loss: 2.114
RISK PROFILE
Risk level: medium
Suggested risk: 1%
Timeframe: 1D
Disclosure: I am part of Trade Nation's Influencer program and receive a monthly fee for using their TradingView charts in my analysis.
✅LIKE AND COMMENT MY IDEAS✅
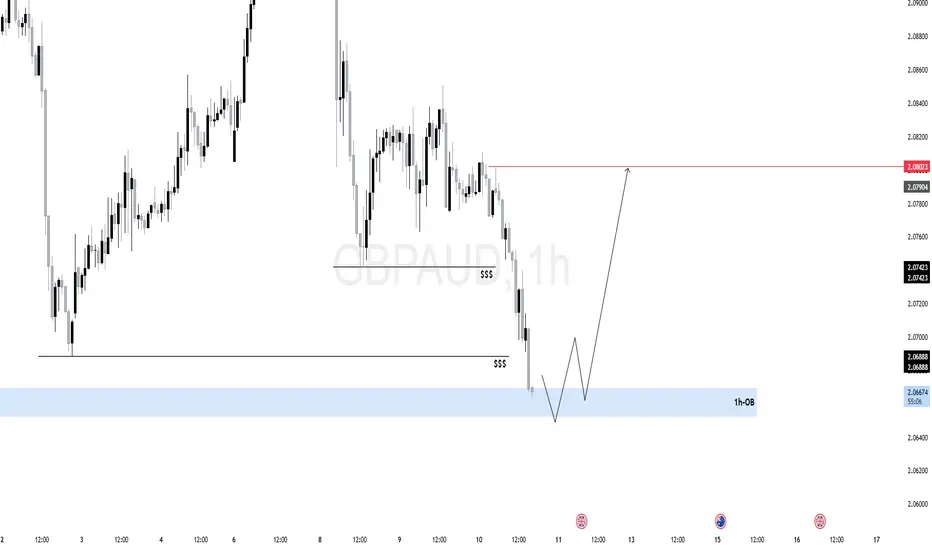
$GA (GBPAUD) 1HIf price holds and reacts from the OB, expect a short-term bullish leg toward:
Internal liquidity first (2.07400), Then external buy-side liquidity above 2.08000.
Price has been in a clear bearish structure, printing lower highs and lower lows.
Recently, price swept multiple layers of internal liquidity (marked as $$$) before tapping into a key Order Block (OB) just above the 2.06500 zone.
The OB zone aligns with a higher timeframe demand area, suggesting this could be a reaccumulation phase.
The OB zone has previously led to strong expansions, making it a valid area for institutional re-entry.
The current liquidity grab beneath the previous lows appears intentional — a trap for breakout sellers.
Smart money often waits for such sweeps to absorb sell-side liquidity before shifting the structure.

Is the currency GBPAUD depreciating?
Hi dears
I think that if the colored trend line is broken, the downtrend will probably continue until it reaches the target.
Thank you for supporting me by liking, commenting, and subscribing.

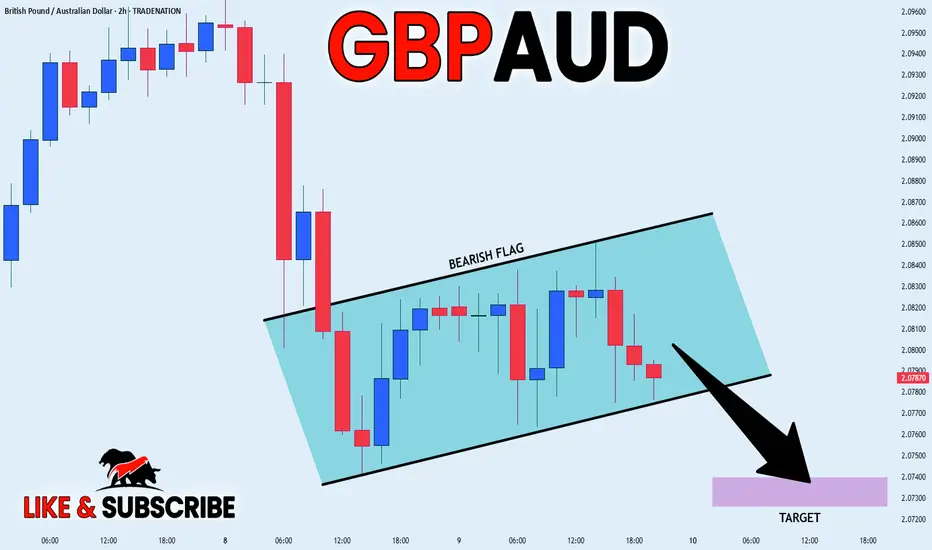
GBP_AUD BEARISH FLAG|SHORT|
✅GBP_AUD is going down now
And the pair has formed
A bearish flag pattern
Which makes me bearish biased
And after the breakout
I believe we will see bearish continuation
SHORT🔥
✅Like and subscribe to never miss a new idea!✅
Disclosure: I am part of Trade Nation's Influencer program and receive a monthly fee for using their TradingView charts in my analysis.
Tap and goWe might see this guy tapping on that POI after taking out that previous low, then push up


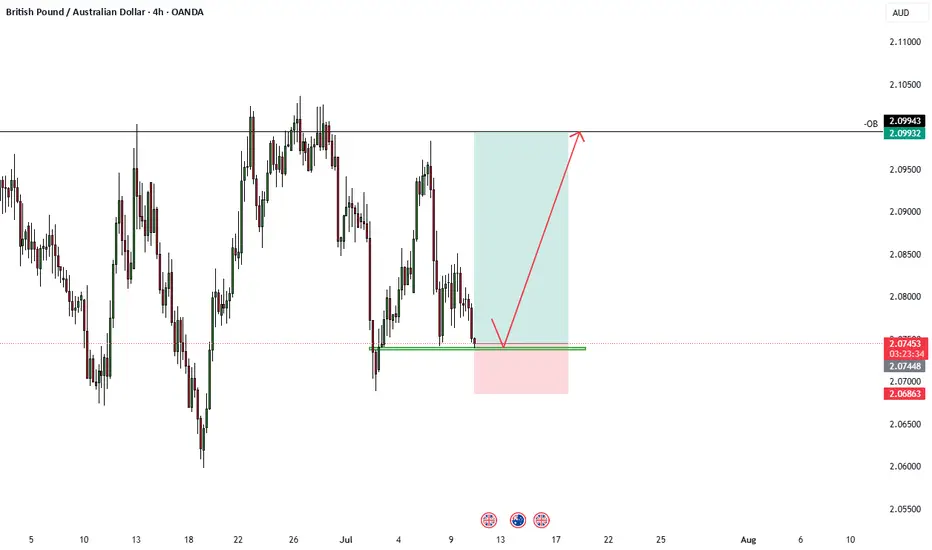
GBPAUD 1:4.25 Trade Idea - ICT1:4.25 Trade Idea on GBPAUD, bullish on the pair looking good to re-test the -OB on the daily.
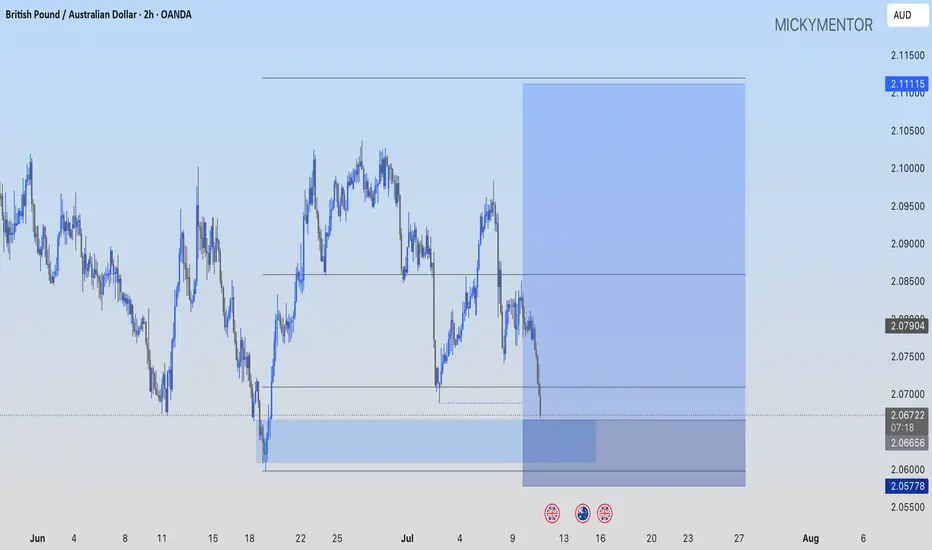
GBPAUD: Bounce-and-Fill into 2.0830
Price just tagged 2.0731 the former ceiling that’s now acting as intraday support, and printed a clean rejection wick. If that level holds, I’m looking for bulls to squeeze us back toward the 2.0810-2.0830 supply zone . From there, I’ll watch for fresh sell signals. Bias flips only if 2.0731 breaks convincingly.

GBPAUD .BEARISH TREND 4HR and Daily Chart Analaysis GBP/AUD is expected to enter a bearish phase for an extended period, potentially declining from the levels of 2.10074 – 2.08638. The next key support zone in this downtrend lies between 2.02569 and 2.01459, where a potential bullish reaction may occur. However, traders should approach this setup with caution, as it carries significant risk and is likely to unfold over a longer timeframe—possibly around a month

GBPAUD sideways consolidation resistance at 2.1020The GBPAUD remains in a bullish trend, with recent price action showing signs of a corrective pullback within the broader uptrend.
Support Zone: 2.0800 – a key level from previous consolidation. Price is currently testing or approaching this level.
A bullish rebound from 2.0800 would confirm ongoing upside momentum, with potential targets at:
2.1020 – initial resistance
2.1160 – psychological and structural level
2.1310 – extended resistance on the longer-term chart
Bearish Scenario:
A confirmed break and daily close below 2.0800 would weaken the bullish outlook and suggest deeper downside risk toward:
2.0755 – minor support
2.0690 – stronger support and potential demand zone
Outlook:
Bullish bias remains intact while the GBPAUD holds above 2.0800. A sustained break below this level could shift momentum to the downside in the short term.
This communication is for informational purposes only and should not be viewed as any form of recommendation as to a particular course of action or as investment advice. It is not intended as an offer or solicitation for the purchase or sale of any financial instrument or as an official confirmation of any transaction. Opinions, estimates and assumptions expressed herein are made as of the date of this communication and are subject to change without notice. This communication has been prepared based upon information, including market prices, data and other information, believed to be reliable; however, Trade Nation does not warrant its completeness or accuracy. All market prices and market data contained in or attached to this communication are indicative and subject to change without notice.
