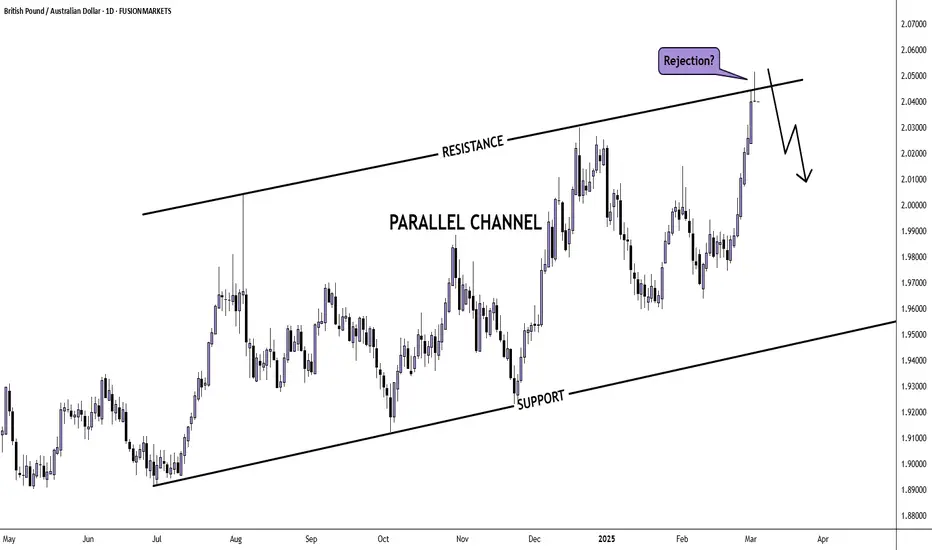
GBPAUD - BEARISH POSSIBILITY- Price closed under the resistence area which indicate a high chance of bearish reaction to the resistence zone
- We can observe that price been following an uptrend line, a breakout will add up as confirmation to the bearish possibitlity
- A retest can be seen as price confirming respect towards the resistence area and the trend breakout as well. It can also be seen as a great entry zone for it put your trades in a great risk/ reward ratio of 2.5 but you can also wait for price rejection as a stronger bearish confirmation.
*Educational purpose only
AUDGBP trade ideas

gbpaud analysis elliot. Don't forget about stop-loss.
Write in the comments all your questions and instruments analysis of which you want to see.
Friends, push the like button, write a comment, and share with your mates - that would be the best THANK YOU.
P.S. I personally will open entry if the price will show it according to my strategy.
Always make your analysis before a trade

GBPAUD Bullish breakout supported at 2.0227The GBPAUD currency pair maintains a bullish sentiment, supported by the prevailing long-term uptrend. However, recent price action suggests an overextended bullish breakout, approaching significant resistance zones on both daily and weekly timeframes.
The key trading level to watch is 2.0227. A potential overbought pullback from current levels, followed by a bullish rebound from 2.0227, could extend the upside, targeting 2.0499, with further resistance at 2.0577 and 2.0737 over a longer timeframe.
Conversely, a confirmed break below 2.0227, with a daily close under this level, could signal a corrective pullback towards 2.0077 and 2.9937.
Conclusion:
While the broader trend remains bullish, the current overextended move suggests the possibility of short-term retracements. Holding 2.0227 as support will be critical for further upside continuation, while a breakdown below this level could trigger deeper corrections. Traders should monitor price action closely and adjust risk management accordingly.
This communication is for informational purposes only and should not be viewed as any form of recommendation as to a particular course of action or as investment advice. It is not intended as an offer or solicitation for the purchase or sale of any financial instrument or as an official confirmation of any transaction. Opinions, estimates and assumptions expressed herein are made as of the date of this communication and are subject to change without notice. This communication has been prepared based upon information, including market prices, data and other information, believed to be reliable; however, Trade Nation does not warrant its completeness or accuracy. All market prices and market data contained in or attached to this communication are indicative and subject to change without notice.


GBPAUD-SELL strategy 6 hourly chartWe had some correction back to 2.0287 and fell short of the expected 2.0217. Currently there is upside pressure, and the strategy could be even to BUY into weakness short-term. However, I prefer to focus on overall regression channel, which suggests we should not sustain levels above 2.0550 -2.0600.
Strategy SELL @ 2.0550 - 2.0575 and take profit near 2.0217 (still).

GBP_AUD WILL GROW|LONG|
✅GBP_AUD is set to retest a
Strong support level below at 2.0270
After trading in a local downtrend from some time
Which makes a bullish rebound a likely scenario
With the target being a local resistance above at 2.0400
LONG🚀
✅Like and subscribe to never miss a new idea!✅

GBPAUD SELL / BUY TRADE PLAN🔴 PRIMARY TRADE – SELL SETUP (REVISED BASED ON LIVE REACTION)
🔻 SELL ENTRY (Revised to Catch the Best Entry)
🔹 Aggressive Entry: If price retests 2.0480 – 2.0500, enter a Sell Limit (re-entry into rejection zone).
🔹 Confirmation Entry: If price fails to break above 2.0450 & forms rejection (Engulfing, Fakeout, or Pin Bar) on M15/M30/H1, take a market execution sell.
🔹 SL: 2.0530 (Above liquidity grab & invalidation zone).
🔹 TP1: 2.0400 (Nearest support, move SL to breakeven).
🔹 TP2: 2.0320 (Liquidity target).
🔹 TP3: 2.0250 – 2.0200 (Full reversal target).
✅ Risk-Reward Ratio: 1:3+
🎯 Confidence Level: ✅✅✅✅ (High Probability Trade – Strong Structural & Liquidity Confluence).
📌 Why this sell setup is still valid?
🔹 H4 bearish engulfing confirms institutional selling pressure.
🔹 H1 bearish divergence signals momentum weakness.
🔹 Price has already rejected 2.0500, so a lower high at 2.0480 – 2.0500 would be a great re-entry.
🔹 If price does not retest, a break & rejection below 2.0450 offers a confirmation entry.
🟢 SECONDARY TRADE – BUY SETUP (IF SELL FAILS OR DEEP RETRACE OCCURS)
🔹 BUY ENTRY (Unchanged)
🔹 Aggressive Entry: Buy Limit at 2.0250 – 2.0200 (Institutional Demand Zone).
🔹 Confirmation Entry: Wait for bullish rejection (Wick Rejection, Bullish Engulfing, or Fakeout) above 2.0250.
🔹 SL: 2.0150 (Below liquidity grab zone).
🔹 TP1: 2.0320 (First resistance, move SL to breakeven).
🔹 TP2: 2.0400 – 2.0450 (Extended move based on liquidity).
🔹 TP3: 2.0500 – 2.0550 (Full bullish target).
✅ Risk-Reward Ratio: 1:3+
🎯 Confidence Level: ✅✅✅ (Medium-High, depends on sell reaction at 2.0500).
📌 Why consider buying here?
🔹 Price would retrace into institutional demand at 2.0250 – 2.0200.
🔹 Strong reaction zone with previous liquidity grab & fair value gap.
🔹 Aligns with Fibonacci retracement (50% – 61.8%) & previous demand area.

GBP/AUD BEARISH BIAS RIGHT NOW| SHORT
Hello, Friends!
The BB upper band is nearby so GBP-AUD is in the overbought territory. Thus, despite the uptrend on the 1W timeframe I think that we will see a bearish reaction from the resistance line above and a move down towards the target at around 1.991.
✅LIKE AND COMMENT MY IDEAS✅

GBPAUD Potential Short on a Trend reversal TradeOANDA:GBPAUD made a significant bullish run and interestingly, the move was pretty fast. Looking back in history, Price has hit a major Resistance and created a new low around the 2.03801. This area has been further broken and retested which suggests a possible bearish opportunity. I would recommend to trade this with some caution as the overall bullish move is still potentially on.
Results are not typical, past results does not guarantee future results, so do your due diligence.
Let's talk about your trade ideas too ;-)

GBPAUD BEARISHGBPAUD break HL and print new LL
also formed rsi divergenc
entry at current market price

GBPAUD-SELL strategy 6 hourly chartWe are in the correction mode, and we should be able to see FIB 2.0217 area for profit taking.
Stochastic, fisher form, and RSI all are showing we in SELL mode.
Strategy SELL @ 2.0370-2.0400 (or adding to position since we are short at different levels) and take profit near 2.0217 for now. it may go lower, but at least trim or liquidate.

GBPAUDWe have a choch and the price near a D1 strong supply zone now if the price come back to our level 50% fibo we take it short
LR

GBPAUD - Bearish ReversalGBPAUD has formed a double top and broken its neckline along with trendline.

GBP-AUD Bullish Bias! Buy!
Hello,Traders!
GBP-AUD is trading in an
Uptrend and the pair
Is making a local correction
But will soon hit a horizontal
Support of 2.0240 from where
We will be expecting a local
Bullish rebound
Buy!
Comment and subscribe to help us grow!
Check out other forecasts below too!
Disclosure: I am part of Trade Nation's Influencer program and receive a monthly fee for using their TradingView charts in my analysis.


Sell GBPAUDThis is a good sell, with the GBP exhausted from an insane bull run and the AUD gaining strength, this works out for a good sell. price failed to make higher highs on 2 attemps

Bullish continuation?GBP/AUD is falling towards the pivot which acts as a pullback support and could bounce to the 1st resistance.
Pivot: 2.0243
1st Support: 2.0099
1st Resistance: 2.0507
Risk Warning:
Trading Forex and CFDs carries a high level of risk to your capital and you should only trade with money you can afford to lose. Trading Forex and CFDs may not be suitable for all investors, so please ensure that you fully understand the risks involved and seek independent advice if necessary.
Disclaimer:
The above opinions given constitute general market commentary, and do not constitute the opinion or advice of IC Markets or any form of personal or investment advice.
Any opinions, news, research, analyses, prices, other information, or links to third-party sites contained on this website are provided on an "as-is" basis, are intended only to be informative, is not an advice nor a recommendation, nor research, or a record of our trading prices, or an offer of, or solicitation for a transaction in any financial instrument and thus should not be treated as such. The information provided does not involve any specific investment objectives, financial situation and needs of any specific person who may receive it. Please be aware, that past performance is not a reliable indicator of future performance and/or results. Past Performance or Forward-looking scenarios based upon the reasonable beliefs of the third-party provider are not a guarantee of future performance. Actual results may differ materially from those anticipated in forward-looking or past performance statements. IC Markets makes no representation or warranty and assumes no liability as to the accuracy or completeness of the information provided, nor any loss arising from any investment based on a recommendation, forecast or any information supplied by any third-party.

GBP/AUD - 1H Analysis & Prediction📊 GBP/AUD - 1H Analysis & Prediction
🔹 Current Price: 2.04496
🔹 Key Support Zones: 2.03800 - 2.03400 (Highlighted in green)
🔹 Key Resistance: 2.05164 & 2.05905
🚀 Bullish Scenario:
✅ Price is forming higher highs and higher lows, indicating an uptrend.
✅ A break above 2.05164 could push GBP/AUD towards the 2.05905 target.
✅ If price pulls back, it may retest the minor support before continuing upwards.
⚠️ Bearish Scenario:
🔻 If price fails to break 2.05164, a rejection could send it back towards 2.03800.
🔻 A deeper correction would test the 2.03400 demand zone.
💡 Trading Plan:
✅ Look for buy opportunities if price forms bullish confirmation above 2.04500.
✅ A breakout above 2.05164 may indicate a strong bullish continuation.
✅ If price rejects 2.05164, watch for short-term sell setups.
#FXFOREVER #GBPAUD #SmartMoney #ForexTrading #LiquidityHunt #TradingSetup

GBPAUD-SELL strategy 9 horuly chartThe pair had some minor corrections, but overall we have as yet to see at least near 2.0200 area. the overbought state and stochastic suggest we should see lower in the coming sessions.
Strategy SELL @ 2.0440-2.0490 and take profit near 2.0227.
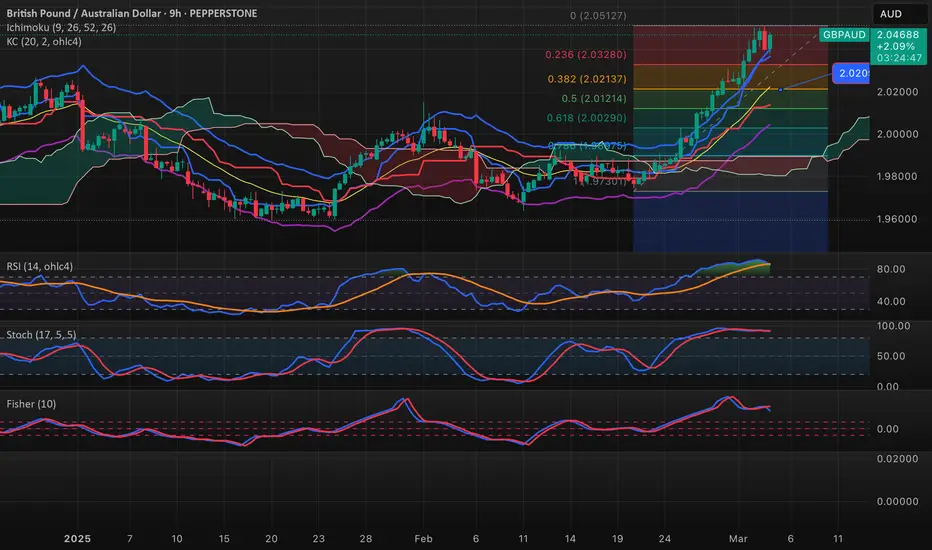
GBP/AUD: Topping Signals Flash After Relentless RallyThe bearish pin candle on the GBP/AUD daily chart on Tuesday is a warning sign for bulls after a more than seven big-figure rally in less than a fortnight. RSI (14) is flashing extreme overbought conditions, sitting at levels that have marked major market tops in the past.
Fundamentally, the move stacks up—improved Eurozone optimism from increased military spending and weaker energy prices is a tailwind for the U.K., while ongoing U.S.-China tariff skirmishes weigh on the AUD, overshadowing early signs of an Australian economic recovery.
But that’s all baked in now, leaving GBP/AUD vulnerable to downside without fresh catalysts to push the narrative further.
If the pair nears Tuesday’s high, it could offer an entry point for those looking to fade the move. Stops could be placed above that level, targeting an initial pullback to 2.0300—the December 2024 high. From there, traders can reassess whether to aim for 2.0150 or square the trade.
Good luck!
DS

GBPAUD is BearishPrice was in a steep uptrend, however the bears seem to have taken control of the price action as previous higher low is broken successfully, if the selling pressure continues we can expect a bearish rally as per Dow theory. Targets are mentioned on the chart.

GBPAUD SELL SETUPPrice gave strong bearish rejection from supply. I believe we are due for a correction here from supply after such a big wave up. I also like the correlating factor with AU holding form bullish. GA tends to be inversely correlated.

GBP/AUD Daily AnalysisPrice has reached resistance at the top of the parallel channel.
Tuesdays candle closed as a bearish pin candle.
This may be the start of sellers entering the market.
An impulse of selling and a correction may produce a sell setup if it meets your trading rules.