Lingrid | AUDJPY possible WEEKLY High BreakoutThe price perfectly fulfilled my last idea . FX:AUDJPY is holding above its upward trendline after rebounding off support near 93.34, forming a higher low structure. The pair is consolidating just below the resistance zone, suggesting a potential continuation toward the 94.15 target. A break above the recent local high could reignite bullish momentum.
📈 Key Levels
Buy zone: 93.34–93.45
Buy trigger: breakout above 93.80
Target: 94.15
Sell trigger: breakdown below 93.30
💡 Risks
Rejection from 93.80 weakens the upward setup
Drop below trendline support may signal a shift to downside
False breakout above 94.00 could trap early buyers
Traders, if you liked this idea or if you have your own opinion about it, write in the comments. I will be glad 👩💻
AUDJPY trade ideas

AUD-JPY Will Keep Growing! Buy!
Hello,Traders!
AUD-JPY made a bullish
Breakout of the key
Horizontal level of 93.800
And the breakout is confirmed
So we are bullish biased
And we will be expecting
A further bullish move up
Buy!
Comment and subscribe to help us grow!
Check out other forecasts below too!
Disclosure: I am part of Trade Nation's Influencer program and receive a monthly fee for using their TradingView charts in my analysis.


AUDJPY Potential UpsidesHey Traders, in today's trading session we are monitoring AUDJPY for a buying opportunity around 94.000 zone, AUDJPY is trading in an uptrend and currently is in a correction phase in which it is approaching the trend at 94.000 support and resistance area.
Trade safe, Joe.

AUDJPY - Bullish Double BottomHello Traders !
The AUDJPY price formed a double bottom pattern.
Currently, The neckline is broken!
So, I expect a bullish move🚀
______________
TARGET: 95.110🎯

AUDJPY Technical & Order Flow AnalysisOur analysis is based on multi-timeframe top-down analysis & fundamental analysis.
Based on our assessment, the price will rise to the monthly level.
DISCLAIMER: This analysis can change anytime without notice and is only for assisting traders in making independent investment decisions. Please note that this is a prediction, and I have no reason to act on it, and neither should you.
Please support our analysis with a boost or comment!

Australian Dollar Setups: AUD/USD, EUR/AUD, AUD/NZD, AUD/JPYAn update to the prior Aussie dollar video, where I reassess the setups and decide which ones I prefer.
Matt Simpson, Market Analyst at City Index and Forex.com.

AUDJPY Market Forecast – Level 3 Completion & Potential ResetThis chart illustrates a classic Market Maker 3-Level Rise Pattern:
Level 1: Initiated after a consolidation phase, marked by a clear shift in structure.
Level 2: Continued bullish expansion with stronger impulsive candles.
Level 3: Price reaches an overextended zone with signs of slowing momentum, indicating a potential distribution or retracement phase.
Key Forecast:
A retracement is expected toward the 93.297 zone, which aligns with:
Possible reaccumulating point before continuation
This move may serve as a manipulation trap to grab liquidity below recent lows before pushing higher. If price reacts strongly at 93.297 with bullish structure, a long setup targeting new highs (~94.40+) is favored.

AUDJPY Possible Short PossitionAfter the price hit our resistance level, we will go to a lower timeframe and await confirmation before shorting.

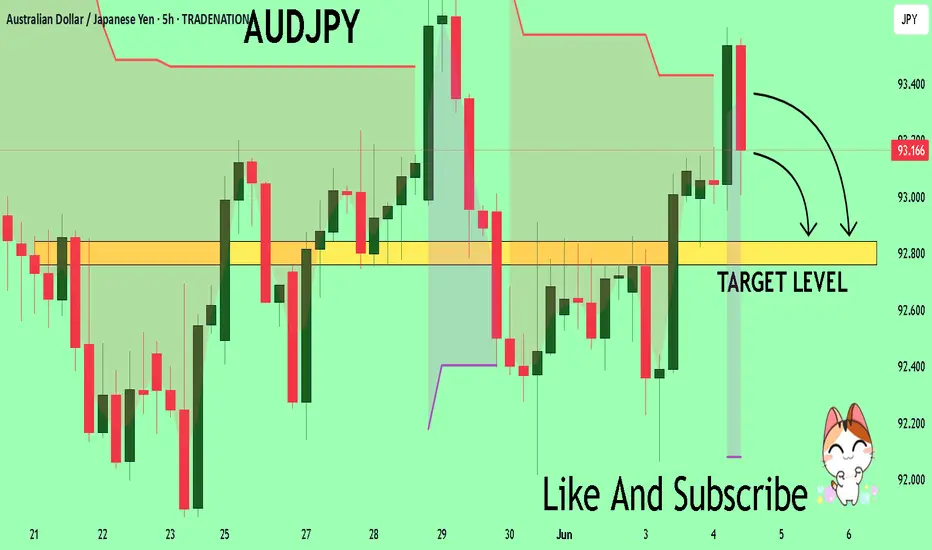
AUD/JPY SELLERS WILL DOMINATE THE MARKET|SHORT
AUD/JPY SIGNAL
Trade Direction: short
Entry Level: 93.511
Target Level: 93.135
Stop Loss: 93.760
RISK PROFILE
Risk level: medium
Suggested risk: 1%
Timeframe: 1h
Disclosure: I am part of Trade Nation's Influencer program and receive a monthly fee for using their TradingView charts in my analysis.
✅LIKE AND COMMENT MY IDEAS✅

AUDJPY: Pullback Confirmed?! 🇦🇺🇯🇵
There is a high chance that AUDJPY will pull back
from the underlined resistance cluster.
Its false violation, a formation of a bearish imbalance candle
and a breakout of a rising trend line provide strong bearish confirmation.
Goal - 93.185
❤️Please, support my work with like, thank you!❤️
I am part of Trade Nation's Influencer program and receive a monthly fee for using their TradingView charts in my analysis.

Bullish bounce?AUD/JPY has bounced off the pivot and could rise to the 1st resistance.
Pivot: 92.79
1st Support: 92.15
1st Resistance: 93.84
Risk Warning:
Trading Forex and CFDs carries a high level of risk to your capital and you should only trade with money you can afford to lose. Trading Forex and CFDs may not be suitable for all investors, so please ensure that you fully understand the risks involved and seek independent advice if necessary.
Disclaimer:
The above opinions given constitute general market commentary, and do not constitute the opinion or advice of IC Markets or any form of personal or investment advice.
Any opinions, news, research, analyses, prices, other information, or links to third-party sites contained on this website are provided on an "as-is" basis, are intended only to be informative, is not an advice nor a recommendation, nor research, or a record of our trading prices, or an offer of, or solicitation for a transaction in any financial instrument and thus should not be treated as such. The information provided does not involve any specific investment objectives, financial situation and needs of any specific person who may receive it. Please be aware, that past performance is not a reliable indicator of future performance and/or results. Past Performance or Forward-looking scenarios based upon the reasonable beliefs of the third-party provider are not a guarantee of future performance. Actual results may differ materially from those anticipated in forward-looking or past performance statements. IC Markets makes no representation or warranty and assumes no liability as to the accuracy or completeness of the information provided, nor any loss arising from any investment based on a recommendation, forecast or any information supplied by any third-party.

AUDJPY Begins Elliot Correction After Wave 5 Impulse EndsOANDA:AUDJPY seems to have started a Elliot Correction Wave after the Impulsive Elliot Wave came to a finish once Wave 5 ended this morning @ 93.774.
Now after an Impulsive Wave ends, its theory that a Correction comes next and with Price having Retraced to the Golden Ratio creating a Lower High, this is the beginning signs of that theory in the works!
The Sequence will be confirmed once Price Breaks below Point A @ 93.248 where then we should suspect Price to find itself back down into the 92 range where the Correction Wave should come to an end.
RSI is trading back below 50 confirming Price has room to move lower strengthening the Bearish Bias.

FOMO & An Inside Bar Entry Into A Larger Head & Shoulder PatternAn handful of lessons in this video so hang on.
1) We take a look at the dangers that come with entering a trade too early & what you should do if you ever find yourself in that situation.
2) A discussion ion inside bars, what they are, how to trade them and an indicator that will help you spot them.
3) How to use that inside bar as an entry reason into a bigger head and shoulders pattern on the larger timeframe.
Please leave any questions or comments below!
Akil

AUDJPY: Consolidation is Over!🇦🇺🇯🇵
AUDJPY is completed a consolidation, violating
a resistance of a horizontal range on a daily.
The price will most likely continue rising and reach 95.0 level soon.
❤️Please, support my work with like, thank you!❤️

AUDJPY - In a corrective StructureHi Traders,
I am anticipating this range.
BUY at the bottom and SELL at the top.
Good Luck

AUDJPY SHORT FORECAST Q2 W23 D2 Y25AUDJPY SHORT FORECAST Q2 W23 D2 Y25
Professional Risk Managers👋
Welcome back to another FRGNT chart update📈
Diving into some Forex setups using predominantly higher time frame order blocks alongside confirmation breaks of structure.
Let’s see what price action is telling us today! 👀
💡Here are some trade confluences📝
✅Weekly Order block rejection
✅15' Order block identification
✅4H 50EMA
✅Daily 50 EMA
🔑 Remember, to participate in trading comes always with a degree of risk, therefore as professional risk managers it remains vital that we stick to our risk management plan as well as our trading strategies.
📈The rest, we leave to the balance of probabilities.
💡Fail to plan. Plan to fail.
🏆It has always been that simple.
❤️Good luck with your trading journey, I shall see you at the very top.
🎯Trade consistent, FRGNT X

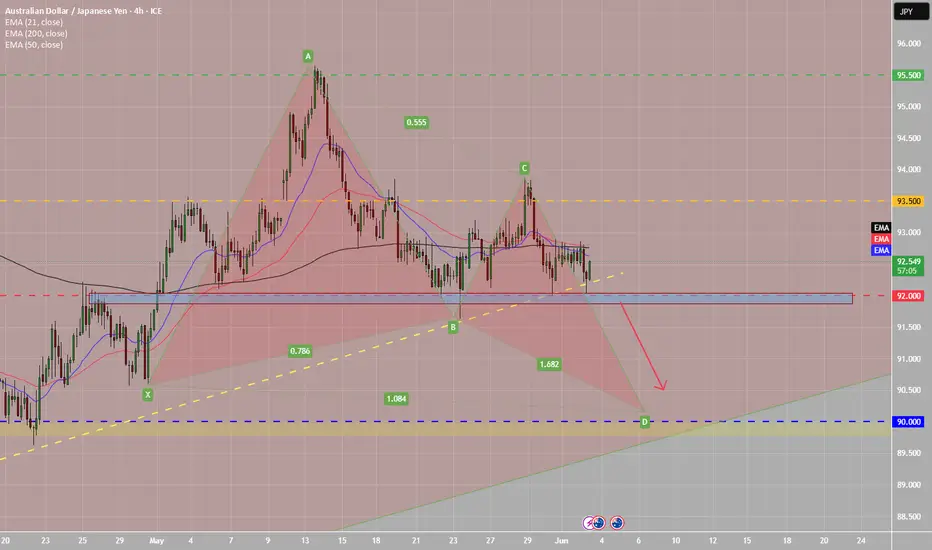
AJ BEARISH BUTTERFLY C-D PATTERN Strong support @92.00, if price breaks below mentioned level and breaks bullish 4h trendline, it would validate a move towards monthly support. As long a C leg resistance holds strong I will only be looking for shorts.
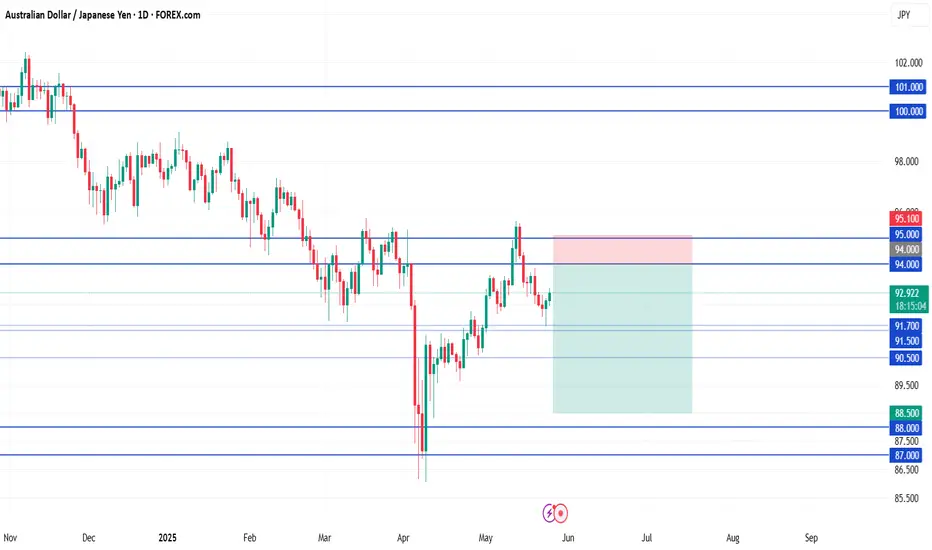
AUD/JPY Short📍 AUD/JPY Short Setup – Sell Limit Order
Entry: 94.00
(clean retest of daily + weekly resistance zone, aligned with previous structure)
Stop Loss: 95.10
Take Profit 1: 91.00
(recent support shelf with high reaction probability)
Take Profit 2: 88.50
(strong weekly support zone; ideal mid-term target if momentum continues)
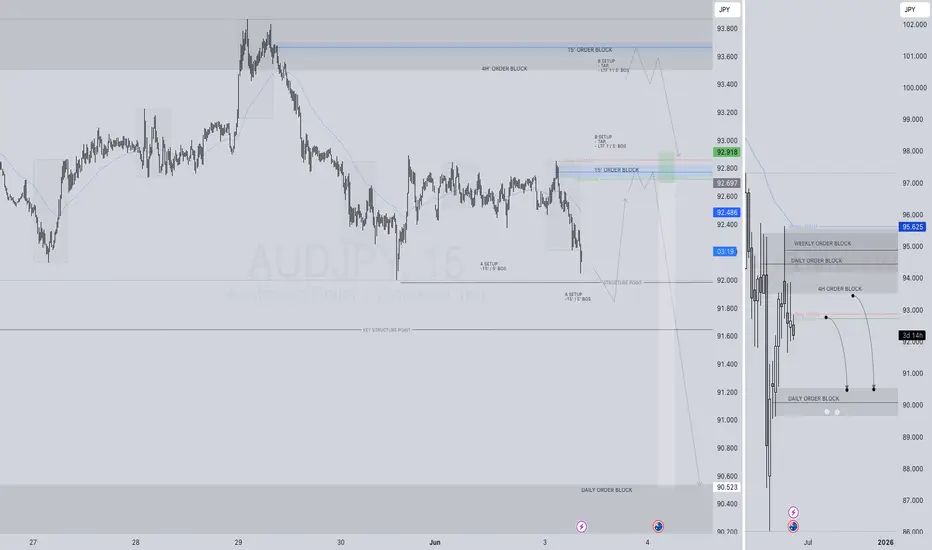
AUDJPY SHORT FORECAST Q2 W23 D3 Y25AUDJPY SHORT FORECAST Q2 W23 D3 Y25
Professional Risk Managers👋
Welcome back to another FRGNT chart update📈
Diving into some Forex setups using predominantly higher time frame order blocks alongside confirmation breaks of structure.
Let’s see what price action is telling us today! 👀
💡Here are some trade confluences📝
✅Weekly Order block rejection
✅15' Order block identification
✅4H 50EMA
✅Daily 50 EMA
🔑 Remember, to participate in trading comes always with a degree of risk, therefore as professional risk managers it remains vital that we stick to our risk management plan as well as our trading strategies.
📈The rest, we leave to the balance of probabilities.
💡Fail to plan. Plan to fail.
🏆It has always been that simple.
❤️Good luck with your trading journey, I shall see you at the very top.
🎯Trade consistent, FRGNT X
AUDJPY Trading Opportunity! SELL!
My dear friends,
Please, find my technical outlook for AUDJPY below:
The instrument tests an important psychological level 93.263
Bias - Bearish
Technical Indicators: Supper Trend gives a precise Bearish signal, while Pivot Point HL predicts price changes and potential reversals in the market.
Target - 92.841
About Used Indicators:
Super-trend indicator is more useful in trending markets where there are clear uptrends and downtrends in price.
Disclosure: I am part of Trade Nation's Influencer program and receive a monthly fee for using their TradingView charts in my analysis.
———————————
WISH YOU ALL LUCK
AUDJPY BOUNCE BACKTechnically:
AUDJPY bounce back from support level.first target is 93.910 if it break then next target will be 95.570

AUDJPY pull back to FVG then LongAUDJPY Long Setup (Preliminary Plan)
Target Levels:
First Target: 94.300
Second Target: 94.800
Strategy:
Looking for bullish price action (PA) confirmation around the highlighted Fair Value Gap (FVG).
Expecting a possible breach of minor resistance on open, which may lead to a push toward the first target at 94.300.
A pullback may follow after the first target is hit.
Notes:
This setup is preliminary and subject to adjustment.
Live price action will be monitored before executing the trade.
