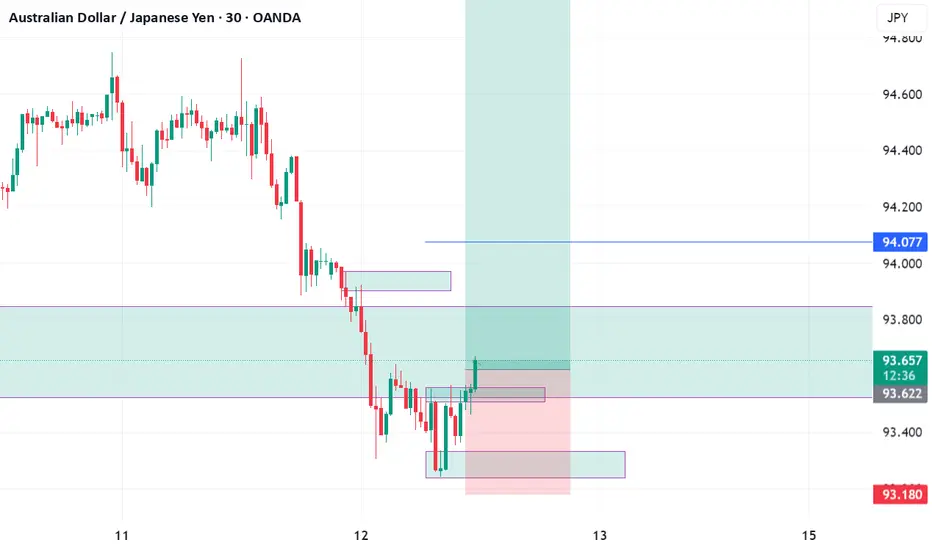
AUDJPY Potential UpsidesHey Traders, in today's trading session we are monitoring AUDJPY for a buying opportunity around 93.600 zone, AUDJPY is trading in an uptrend and currently is in a correction phase in which it is approaching the trend at 93.600 support and resistance area.
Trade safe, Joe.
AUDJPY trade ideas

AUDJPY Will Go Lower From Resistance! Sell!
Take a look at our analysis for AUDJPY.
Time Frame: 30m
Current Trend: Bearish
Sentiment: Overbought (based on 7-period RSI)
Forecast: Bearish
The market is on a crucial zone of supply 93.507.
The above-mentioned technicals clearly indicate the dominance of sellers on the market. I recommend shorting the instrument, aiming at 93.232 level.
P.S
Please, note that an oversold/overbought condition can last for a long time, and therefore being oversold/overbought doesn't mean a price rally will come soon, or at all.
Disclosure: I am part of Trade Nation's Influencer program and receive a monthly fee for using their TradingView charts in my analysis.
Like and subscribe and comment my ideas if you enjoy them!

PRICE ACTION IN MY VIEW 1. 4-Hour Chart:
○ You identify a clear uptrend (making HH and HL).
○ You mark a significant 4-hour Support Level where price has bounced strongly multiple times in the past.
○ Confluence: Strong uptrend + major support. Your bias is to buy.
2. 30-Minute Chart:
○ Price pulls back from a recent high and approaches your identified 4-hour support level.
○ As price touches the 4-hour support, a large Bullish Engulfing Bar forms and closes. The body of this candle completely engulfs the previous bearish candle.
○ Confluence: Price at 4H support + Bullish Engulfing Bar + aligns with 4H uptrend. This is your potential setup.
3. 5-Minute Chart:
○ After the 30-minute Bullish Engulfing Bar closes, you switch to the 5-minute chart.
○ You see that after the engulfing bar, the 5-minute chart has formed a new higher low and then broken above a short-term 5-minute resistance level, with a strong bullish 5-minute candle closing above it.
○ Entry: You enter a long trade immediately after the 5-minute confirmation candle closes.
○ Stop Loss: Place your stop loss just below the low of the 30-minute Bullish Engulfing Bar (or slightly below the 4-hour support).
○ Take Profit: Identify the next major 4-hour resistance level as your target.
○ Confluence: 30M signal confirmed by 5M structure break + tight stop loss placement.
AUDJPY SHORT FORECAST Q2 W23 D10 Y25AUDJPY SHORT FORECAST Q2 W23 D10 Y25
Professional Risk Managers👋
Welcome back to another FRGNT chart update📈
Diving into some Forex setups using predominantly higher time frame order blocks alongside confirmation breaks of structure.
Let’s see what price action is telling us today! 👀
💡Here are some trade confluences📝
✅Weekly Order block rejection
✅15' Order block to be confirmed
✅4H 50EMA
✅Daily 50 EMA
🔑 Remember, to participate in trading comes always with a degree of risk, therefore as professional risk managers it remains vital that we stick to our risk management plan as well as our trading strategies.
📈The rest, we leave to the balance of probabilities.
💡Fail to plan. Plan to fail.
🏆It has always been that simple.
❤️Good luck with your trading journey, I shall see you at the very top.
🎯Trade consistent, FRGNT X

AUDJPY Potential UpsidesHey Traders, in today's trading session we are monitoring AUDJPY for a buying opportunity around 94.000 zone, AUDJPY is trading in an uptrend and currently is in a correction phase in which it is approaching the trend at 94.000 support and resistance area.
Trade safe, Joe.

AUDJPY - Bullish Double BottomHello Traders !
The AUDJPY price formed a double bottom pattern.
Currently, The neckline is broken!
So, I expect a bullish move🚀
______________
TARGET: 95.110🎯

AUDJPY - Double Bottom PatternHello Traders !
As we talked in the previous analysis, The AUDJPY price formed a double bottom pattern.
The price has pulled back to neckline and will now continue its bullish movement.
So, I expect a bullish move🚀
______________
TARGET: 95.110🎯

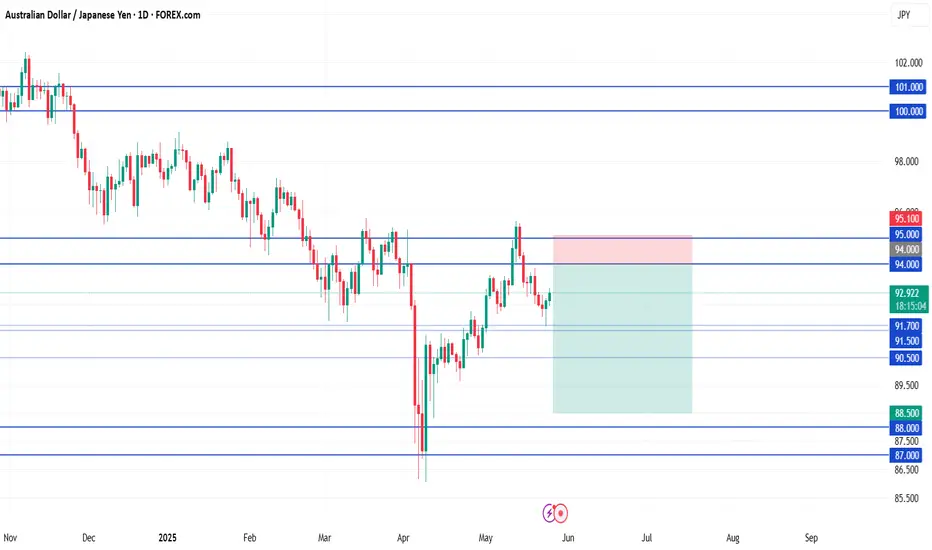
AUD/JPY Short📍 AUD/JPY Short Setup – Sell Limit Order
Entry: 94.00
(clean retest of daily + weekly resistance zone, aligned with previous structure)
Stop Loss: 95.10
Take Profit 1: 91.00
(recent support shelf with high reaction probability)
Take Profit 2: 88.50
(strong weekly support zone; ideal mid-term target if momentum continues)

AUDJPY Bullish Breakout supported at 92.00The AUD/JPY pair is currently maintaining a bullish bias, underpinned by an ongoing uptrend. Recent price action shows sideways consolidation, typically a sign of trend continuation when occurring within an established bullish structure.
Key Level: 91.50
This level marks a prior consolidation zone and now acts as a critical support area.
Bullish Scenario (bounce from 91.50):
A corrective dip to 91.50 followed by a strong bounce would support the bullish continuation.
Upside targets include:
94.20 – Immediate resistance
94.90 – Previous swing high
95.90 – Longer-term resistance
Bearish Scenario (break below 91.50):
A daily close below 91.50 would weaken the bullish outlook.
In this case, downside support levels include:
90.50 – Initial retracement target
89.40 – Deeper support zone
Conclusion
The outlook for AUD/JPY remains bullish while price holds above the key 91.50 support level. A successful bounce from this zone could lead to a retest of higher resistance levels at 94.20 and above. However, a confirmed break below 91.50 would shift sentiment to neutral-to-bearish, potentially triggering further declines toward 90.50 and 89.40. Traders should monitor price behavior at 91.50 for near-term directional cues.
This communication is for informational purposes only and should not be viewed as any form of recommendation as to a particular course of action or as investment advice. It is not intended as an offer or solicitation for the purchase or sale of any financial instrument or as an official confirmation of any transaction. Opinions, estimates and assumptions expressed herein are made as of the date of this communication and are subject to change without notice. This communication has been prepared based upon information, including market prices, data and other information, believed to be reliable; however, Trade Nation does not warrant its completeness or accuracy. All market prices and market data contained in or attached to this communication are indicative and subject to change without notice.

Lingrid | AUDJPY possible WEEKLY High BreakoutThe price perfectly fulfilled my last idea . FX:AUDJPY is holding above its upward trendline after rebounding off support near 93.34, forming a higher low structure. The pair is consolidating just below the resistance zone, suggesting a potential continuation toward the 94.15 target. A break above the recent local high could reignite bullish momentum.
📈 Key Levels
Buy zone: 93.34–93.45
Buy trigger: breakout above 93.80
Target: 94.15
Sell trigger: breakdown below 93.30
💡 Risks
Rejection from 93.80 weakens the upward setup
Drop below trendline support may signal a shift to downside
False breakout above 94.00 could trap early buyers
Traders, if you liked this idea or if you have your own opinion about it, write in the comments. I will be glad 👩💻

AUD-JPY Will Go Down! Sell!
Hello,Traders!
AUD-JPY made a retest
A wide horizontal resistance
Around 93.900 from where
We are already seeing a
Local bearish pullback so
We will be expecting
A further bearish move
Down on Monday
Sell!
Comment and subscribe to help us grow!
Check out other forecasts below too!
Disclosure: I am part of Trade Nation's Influencer program and receive a monthly fee for using their TradingView charts in my analysis.

AUDJPY BUY TRADE PLAN📈 AUDJPY Elite Trade Plan –
📅 Date: June 12, 2025
🎯
Plan Type: Tactical Intraday (Valid for 1–2 Days)
📊 Style: Price Action + Multi-Timeframe Institutional Flow
🔁
Order Type: Market Order on Confirmation (Not a Blind Limit)
🔍 Multi-Timeframe Technical Outlook:
🟢 Weekly:
* Price rebounding off mid-structure after long downtrend.
* Bullish momentum building — candle body expansion for the first time in weeks.
🟢 Daily:
* Higher lows established; price holding above key level 92.80.
* Bullish rejection seen with follow-through — potential path open toward 95.00.
🟢 H4:
* Clean bullish pullback into structure; demand at 93.40–93.60 held.
* No selling momentum visible — structure building for upside continuation.
🟢 H1:
* Reversal impulse confirmed with strong London close engulfing pattern.
* Price now consolidating near 93.60 — preparing for bullish continuation.
✅ Primary Trade Idea – Buy on Demand Retest
Component Level / Detail
🎯 Entry Zone 93.60 – 93.70 (H1 demand + broken structure)
🛑 Stop Loss 93.15 (Below 4H demand and invalidation)
🎯 TP1 94.25 (structure high)
🎯 TP2 94.65 (HTF continuation target)
🎯 TP3 95.00 (HTF bearish OB – final exit)
🧠 Entry Style Market Order on bullish M15/H1 candle confirmation
🕰️ Time Horizon 1–2 day hold (Intraday to Short-Term Swing)
🔮 ForexGPT Elite Forecast Bias
Direction Probability Rationale
🟢 Bullish 75% Strong HTF demand held, bullish close into structure, session flows aligned
🔴 Bearish Trap 25% Only if price breaks below 93.10 with volume – No signs of failure yet
📌 Execution Summary:
💡 “I will only trigger the buy if I see a clean bullish confirmation from 93.60–93.70 zone — ideally an engulfing or rejection wick on M15/H1. If confirmation appears, I’ll execute a market order with SL at 93.15, targeting up to 95.00 depending on momentum.”
⚠️ Risk Management Notes:
* 💼 Size accordingly for 1.5R–2.5R target structure.
* 🔁 Trail stop once TP1 is achieved to secure partials.
* 🕒 Avoid entry during high-volatility news unless structure reconfirms.
📢 This is NOT investment advice. Always manage risk.
🔒 Trade plan valid until structure breaks. Updates required on major candle shifts.

Could BOJ's "HOLD" on Rates Turn AUDJPY "On Its Head"?Here I have a Multi-Timeframe analysis on OANDA:AUDJPY which is giving multiple signs of Higher Prices potentially to come!!
First on the Daily we can see that Price formed a Hammer Candle after testing the March 11th Support Zone and as the next Daily candle forms (Today), we are already seeing a Bullish Confirmation candle begin!
*Bullish Engulfing would be a textbook Confirmation Candle!
Now zooming into the 4Hr / 1 Hr Charts, this Hammer is formed by what looks to be a very Strong Reversal Pattern, the Inverted Head and Shoulders!
Now we are still waiting for the Confirmation of the Pattern where Price needs to rise to the "Neckline" or Resistance Level.
Once Confirmed, we will look for a Breakout of the Pattern and if Validated, could deliver great Long Opportunities as a Breakout and Retest of the Inverted Head and Shoulders Pattern!
If the Pattern is Successful, we could expect the Price Target to be at the next level of Resistance being the 95.3 - 95.6 Area!
Fundamentally, the BOJ begins the week with Policy Rate decision Monday evening where they forecast a HOLD on Interest Rates, staying at .5%. This could have drastic implications on the JPY, potentially weakening it.

AUDJPY – Watching 93.95 SupportPrice just tapped the 50% fib zone around 93.95, where buyers stepped in last time. If this support holds, I’m looking for a bounce toward 94.58. A clean break below the zone cancels the idea—risk stays tight.

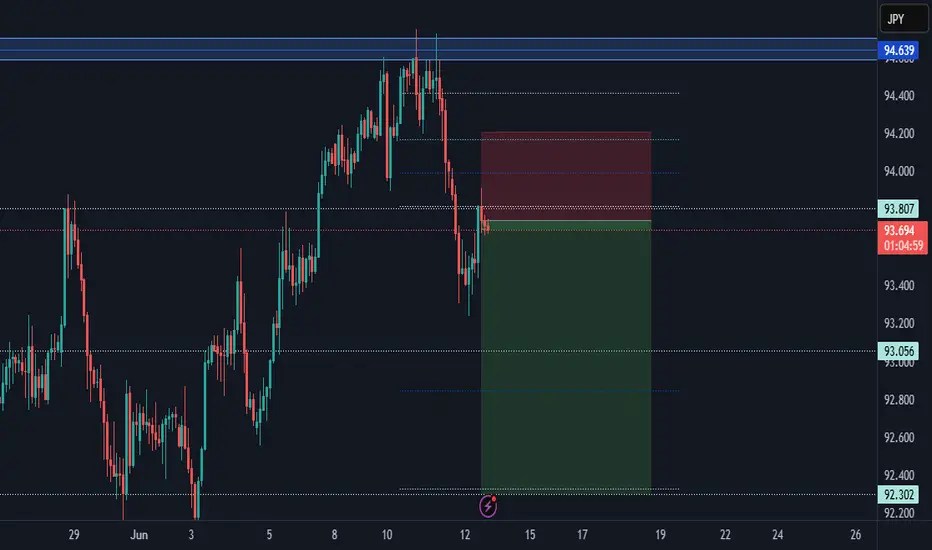
AUDJPY Rejects Resistance – Bearish Momentum May ResumeHey Traders,
AUDJPY has recently reversed from the key resistance zone near 94.60, showing signs of short-term weakness. Price action has broken below the previous structure and is now attempting a retest of the 93.80 area, which could act as fresh resistance and trigger the next bearish leg.
Current Market Conditions:
The pair rejected a major resistance zone (94.60) after forming a swing high and printing consecutive bearish candles.
Currently retesting the broken support-now-turned-resistance at around 93.80.
A confirmed rejection here may accelerate the move toward the next support around 93.05, and further down to 92.30.
Fundamental Analysis/Outlook:
AUD is under pressure following weaker-than-expected Chinese data, Australia’s largest trading partner, raising concerns about reduced demand for Australian exports. Meanwhile, the JPY is seeing slight safe-haven bids as global equities show mixed sentiment ahead of the U.S. CPI and FOMC decision. This macro setup favors a bearish bias on AUDJPY as risk appetite cools and the yen regains some strength.
Targets:
TP1: 93.05
TP2: 92.30
TP3 (extended): 91.80 if downside momentum intensifies
Risk Management:
Stop-Loss: Above 94.20 to protect against bullish breakout
Confirm rejection at 93.80 before committing to position sizing
Risk no more than 1-2% per trade; stick to your plan.
Technical Outlook:
Strong bearish rejection from resistance
Retest of key level aligns with structure-based entries
Downward price channel may be forming if support breaks
Conclusion:
AUDJPY appears ready for further downside if 93.80 holds as resistance. Watch for more bearish confirmation before entry—this setup offers solid R:R potential for both day and swing traders.
Sign-off:
"Patience in trading is not waiting without action, but waiting with purpose."
I would love to hear your thoughts in the comment section, and please hit boost and follow for more ideas. Thank you, and profitable trading to you all!
AUDJPY Forming A Bullish Set-upAUDJPY is recovering very nicely after touching the 86 support level, which goes back to the 2023 low. That was clearly an important zone from there we’ve seen a sharp and impulsive bounce in the last two months, even breaking above the trendline resistance connected down from the 2024 highs. This breakout suggests that bulls may be back in control and could still drive the pair toward the 98–100 area later this year. If we get a retracement in the near term, keep an eye on the 91.70 - 90.00 zone as potential support.
GH

AUDJPY SHORT FORECAST Q2 W24 D13 Y25AUDJPY SHORT FORECAST Q2 W24 D13 Y25
Professional Risk Managers👋
Welcome back to another FRGNT chart update📈
Diving into some Forex setups using predominantly higher time frame order blocks alongside confirmation breaks of structure.
Let’s see what price action is telling us today! 👀
💡Here are some trade confluences📝
✅Weekly Order block rejection
✅15' Order block
✅1H 50EMA
✅Daily order block identified
🔑 Remember, to participate in trading comes always with a degree of risk, therefore as professional risk managers it remains vital that we stick to our risk management plan as well as our trading strategies.
📈The rest, we leave to the balance of probabilities.
💡Fail to plan. Plan to fail.
🏆It has always been that simple.
❤️Good luck with your trading journey, I shall see you at the very top.
🎯Trade consistent, FRGNT X

POSSIBLE SELL OPPORTUNITY ON AUDJPYPrice has rejected from an area of supple just above current price. We are expecting price to take liquidity and push a little more into the supply zone before giving a good sell trade.

AUDJPY Market Forecast – Level 3 Completion & Potential ResetThis chart illustrates a classic Market Maker 3-Level Rise Pattern:
Level 1: Initiated after a consolidation phase, marked by a clear shift in structure.
Level 2: Continued bullish expansion with stronger impulsive candles.
Level 3: Price reaches an overextended zone with signs of slowing momentum, indicating a potential distribution or retracement phase.
Key Forecast:
A retracement is expected toward the 93.297 zone, which aligns with:
Possible reaccumulating point before continuation
This move may serve as a manipulation trap to grab liquidity below recent lows before pushing higher. If price reacts strongly at 93.297 with bullish structure, a long setup targeting new highs (~94.40+) is favored.


AUD/JPY Bulls Eye 95+ After Bullish ReversalAUD/JPY bounced sharply on Thursday, snapping a 3-day losing streak with a solid bullish-range session. The rally kicked off from a bullish pinbar above 92, where the higher low reinforces support and the broader bullish case.
The 1-hour chart shows a clean breakout from an inverted head and shoulders pattern, pointing to a target around 95.50. With resistance at the April high (95.30), March high (95.75), and the 96 handle, there’s still room for bulls to run.
Dips toward 94 may offer opportunities to join the trend — but a break back below the neckline would shift the tone back to risk-off.
Matt Simpson, Market Analyst at City Index and Forex.com
