AUDJPY BOUNCE BACKTechnically:
AUDJPY bounce back from support level.first target is 93.910 if it break then next target will be 95.570
AUDJPY trade ideas

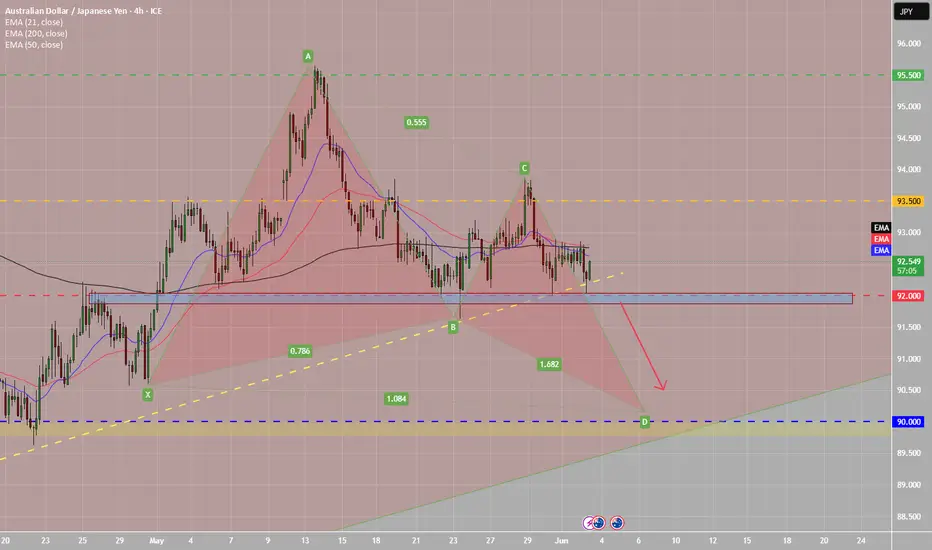
AJ BEARISH BUTTERFLY C-D PATTERN Strong support @92.00, if price breaks below mentioned level and breaks bullish 4h trendline, it would validate a move towards monthly support. As long a C leg resistance holds strong I will only be looking for shorts.
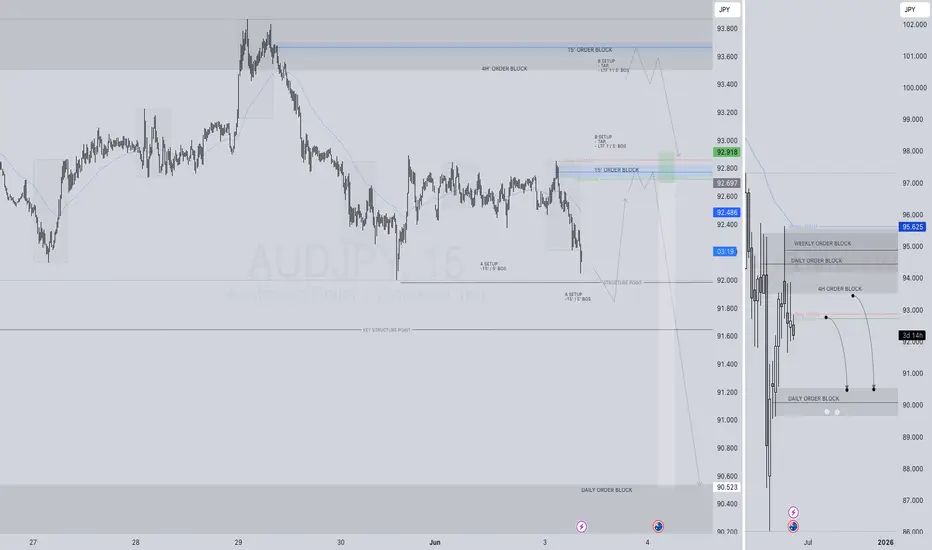
AUDJPY SHORT FORECAST Q2 W23 D3 Y25AUDJPY SHORT FORECAST Q2 W23 D3 Y25
Professional Risk Managers👋
Welcome back to another FRGNT chart update📈
Diving into some Forex setups using predominantly higher time frame order blocks alongside confirmation breaks of structure.
Let’s see what price action is telling us today! 👀
💡Here are some trade confluences📝
✅Weekly Order block rejection
✅15' Order block identification
✅4H 50EMA
✅Daily 50 EMA
🔑 Remember, to participate in trading comes always with a degree of risk, therefore as professional risk managers it remains vital that we stick to our risk management plan as well as our trading strategies.
📈The rest, we leave to the balance of probabilities.
💡Fail to plan. Plan to fail.
🏆It has always been that simple.
❤️Good luck with your trading journey, I shall see you at the very top.
🎯Trade consistent, FRGNT X
AUDJPY SHORT FORECAST Q2 W23 D2 Y25AUDJPY SHORT FORECAST Q2 W23 D2 Y25
Professional Risk Managers👋
Welcome back to another FRGNT chart update📈
Diving into some Forex setups using predominantly higher time frame order blocks alongside confirmation breaks of structure.
Let’s see what price action is telling us today! 👀
💡Here are some trade confluences📝
✅Weekly Order block rejection
✅15' Order block identification
✅4H 50EMA
✅Daily 50 EMA
🔑 Remember, to participate in trading comes always with a degree of risk, therefore as professional risk managers it remains vital that we stick to our risk management plan as well as our trading strategies.
📈The rest, we leave to the balance of probabilities.
💡Fail to plan. Plan to fail.
🏆It has always been that simple.
❤️Good luck with your trading journey, I shall see you at the very top.
🎯Trade consistent, FRGNT X

AUDJPY Breakout Setup | Potential Long OpportunityHello Traders!
We're currently watching a textbook breakout setup forming on the AUD/JPY . After a prolonged consolidation phase, price has finally broken out of the descending trendline that has held for weeks.
🔍 Key Observations:
Consolidation Zone: Price moved sideways within a defined range, building up pressure.
Trendline Break: A clean breakout above the downtrend indicates momentum shift.
Resistance Level at 93.86: A crucial level to watch for confirmation.
Target Level: 95.62 – a significant resistance zone from previous highs.
📊 Trade Idea:
Buy above 93.86 once we see a strong retest or bullish confirmation.
Targets: 95.00 and 95.62.
Stop Loss: Below 93.30 (or as per your risk strategy).
⚠ Risk Management is Key! Always use appropriate stop losses and calculate position sizes based on your risk profile.
Let me know your thoughts below ⬇ Will AUD/JPY explode to 95.60? 🚀
#AUDJPY #Forex #BreakoutTrading #TechnicalAnalysis #TradingSetup #PriceAction


FIRST TRADE OF JUNE AUDJPY 01/06/2025Weekly:
-Bearish W pattern.
-IC.
-Previous week high liquidity sweep.
Daily:
-Bearish W pattern.
-IC.
-H&S pattern.
4H:
-H&S pattern.
-IC.
-FVG.

FOMO & An Inside Bar Entry Into A Larger Head & Shoulder PatternAn handful of lessons in this video so hang on.
1) We take a look at the dangers that come with entering a trade too early & what you should do if you ever find yourself in that situation.
2) A discussion ion inside bars, what they are, how to trade them and an indicator that will help you spot them.
3) How to use that inside bar as an entry reason into a bigger head and shoulders pattern on the larger timeframe.
Please leave any questions or comments below!
Akil

AUDJPY Trading Opportunity! SELL!
My dear subscribers,
This is my opinion on the AUDJPY next move:
The instrument tests an important psychological level 93.501
Bias - Bearish
Technical Indicators: Supper Trend gives a precise Bearish signal, while Pivot Point HL predicts price changes and potential reversals in the market.
Target - 92.966
About Used Indicators:
On the subsequent day, trading above the pivot point is thought to indicate ongoing bullish sentiment, while trading below the pivot point indicates bearish sentiment.
Disclosure: I am part of Trade Nation's Influencer program and receive a monthly fee for using their TradingView charts in my analysis.
———————————
WISH YOU ALL LUCK

AUDJPY Will Go Lower! Short!
Please, check our technical outlook for AUDJPY.
Time Frame: 2h
Current Trend: Bearish
Sentiment: Overbought (based on 7-period RSI)
Forecast: Bearish
The price is testing a key resistance 93.565.
Taking into consideration the current market trend & overbought RSI, chances will be high to see a bearish movement to the downside at least to 92.996 level.
P.S
The term oversold refers to a condition where an asset has traded lower in price and has the potential for a price bounce.
Overbought refers to market scenarios where the instrument is traded considerably higher than its fair value. Overvaluation is caused by market sentiments when there is positive news.
Disclosure: I am part of Trade Nation's Influencer program and receive a monthly fee for using their TradingView charts in my analysis.
Like and subscribe and comment my ideas if you enjoy them!


AUDJPY 240 MINS TIME FRAME - MY VIEWThe Structure looks good to us, waiting for this instrument to correct and then give us these opportunities as shown on this instrument (Price Chart).
Note: Its my view only and its for educational purpose only. Only who has got knowledge about this strategy, will understand what to be done on this setup. its purely based on my technical analysis only (strategies). we don't focus on the short term moves, we look for only for Bullish or Bearish Impulsive moves on the setups after a good price action is formed as per the strategy. we never get into corrective moves. because it will test our patience and also it will be a bullish or a bearish trap. and try trade the big moves.
We do not get into bullish or bearish traps. We anticipate and get into only big bullish or bearish moves (Impulsive Moves). Just ride the Bullish or Bearish Impulsive Move. Learn & Know the Complete Market Cycle.
Buy Low and Sell High Concept. Buy at Cheaper Price and Sell at Expensive Price.
Please keep your comments useful & respectful.
Keep it simple, keep it Unique.
Thanks for your support
Tradelikemee Academy
Saanjayy KG

AUDJPY INTRADAY uptrend supported at 91.50The AUD/JPY pair is currently maintaining a bullish bias, underpinned by an ongoing uptrend. Recent price action shows sideways consolidation, typically a sign of trend continuation when occurring within an established bullish structure.
Key Level: 91.50
This level marks a prior consolidation zone and now acts as a critical support area.
Bullish Scenario (bounce from 91.50):
A corrective dip to 91.50 followed by a strong bounce would support the bullish continuation.
Upside targets include:
94.20 – Immediate resistance
94.90 – Previous swing high
95.90 – Longer-term resistance
Bearish Scenario (break below 91.50):
A daily close below 91.50 would weaken the bullish outlook.
In this case, downside support levels include:
90.50 – Initial retracement target
89.40 – Deeper support zone
Conclusion
The outlook for AUD/JPY remains bullish while price holds above the key 91.50 support level. A successful bounce from this zone could lead to a retest of higher resistance levels at 94.20 and above. However, a confirmed break below 91.50 would shift sentiment to neutral-to-bearish, potentially triggering further declines toward 90.50 and 89.40. Traders should monitor price behavior at 91.50 for near-term directional cues.
This communication is for informational purposes only and should not be viewed as any form of recommendation as to a particular course of action or as investment advice. It is not intended as an offer or solicitation for the purchase or sale of any financial instrument or as an official confirmation of any transaction. Opinions, estimates and assumptions expressed herein are made as of the date of this communication and are subject to change without notice. This communication has been prepared based upon information, including market prices, data and other information, believed to be reliable; however, Trade Nation does not warrant its completeness or accuracy. All market prices and market data contained in or attached to this communication are indicative and subject to change without notice.

AUD/JPY💰Symbol: { AUD/JPY }
🟥sell🟥
🟩Price: { 93.540 }
🟥Stop: { 94.150 }
1️⃣profit: { 92.940 }
2️⃣profit: { 92.130 }
3️⃣profit: { 91.400 }
4️⃣profit: { 90.570 }
5️⃣profit: { 89.690 }
🟩Buy🟩
🟩Price: { 93.720 }
🟥Stop: { 93.140 }
1️⃣profit: { 94.390 }
2️⃣profit: { 95.030 }
3️⃣profit: { 95.500 }
📊Check your chart before entering.
🚨Check before use to make sure there is no important news.🚨

AUDJPY Bounce or Breakdown? Key Levels Ahead
AUDJPY is currently showing bullish signs after a Change of Character (CHoCH) occurred at the 93.800 level. This breakout suggests potential for upward continuation.
The ZigZag structure also supports a bullish wave continuation, with the next Fibonacci-based target around 94.840.
A possible pullback remains valid as long as the price stays above the support zone at 92.700. Any breakdown below that level could weaken the bullish structure.
---------------------
📍 4H Chart Analysis (Supportive Confirmation)
On the higher timeframe (4H), the market appears to be forming an Inverse Head and Shoulders pattern , a strong bullish reversal structure.
- The price is currently building the right shoulder , with a potential neckline breakout targeting 96.000 , a strong psychological resistance.
- Two major scenarios to consider:
1. ✅ If price breaks above the neckline and sustains above 96.000, it could lead to a strong bullish rally.
2. ❌ If price fails to complete the pattern and breaks below the shoulder zone at 92.000, it may trigger a bearish move instead.
---------------------
🧠 Conclusion
As long as 92.700 holds , the 1H bullish scenario remains valid with a near-term target of 94.840 . The 4H chart adds strong structure support via the developing Inverse Head & Shoulders, favoring buyers — unless invalidated by a breakdown below 92.000.
📈 Active Bullish Setup (Above 92.700)
🎯 Target: 94.840 | Max Bull Potential: 96.000
🛑 Invalidation Below: 92.700 / 92.000 (4H shoulder base)

draw linesalways drawing lines on the highest and the lowest of the price movement it tells you what the price is doing,
it will show if there's any trends or consolidations makes a good start point to open your trades


AUDJPY SHORT FORECAST Q2 W22 D29 Y25AUDJPY SHORT FORECAST Q2 W22 D29 Y25
😎CONFLUENCE IS KEY HERE!
Professional Risk Managers👋
Welcome back to another FRGNT chart update📈
Diving into some Forex setups using predominantly higher time frame order blocks alongside confirmation breaks of structure.
Let’s see what price action is telling us today! 👀
💡Here are some trade confluences📝
✅Weekly Order block rejection
✅15' Order block identification
✅4H 50EMA
✅Daily 50 EMA
🔑 Remember, to participate in trading comes always with a degree of risk, therefore as professional risk managers it remains vital that we stick to our risk management plan as well as our trading strategies.
📈The rest, we leave to the balance of probabilities.
💡Fail to plan. Plan to fail.
🏆It has always been that simple.
❤️Good luck with your trading journey, I shall see you at the very top.
🎯Trade consistent, FRGNT X

From Breakdown to Breakout: AUD/JPY Flips Structure Above 92🟡 What happened recently?
At the beginning of April, AUD/JPY dropped to a low of 86, but by early May, the pair had surged over 600 pips, reclaiming the key 92 support level.
Most importantly, price reached a high of 95.50 — breaking well above the descending trendline that started back in July 2024.
📉 The recent pullback confirms the breakout
The drop from 95.50 wasn’t bearish — it was confirmation:
✅ Clear rejection from the 92 zone
✅ Former resistance now acting as strong support
✅ Market structure has shifted to bullish
📈 What’s next?
At the time of writing, AUD/JPY is trading around 92.76, and the structure suggests more upside ahead.
🧭 My strategy:
➡️ Buy dips toward 92.00
➡️ Target: 95.50 — the recent high
🚀 The breakout is confirmed, the trend has shifted, and the opportunity is clear.
Let the market do the work — we just need to stay aligned.
Disclosure: I am part of Trade Nation's Influencer program and receive a monthly fee for using their TradingView charts in my analyses and educational articles.

AUDJPY-H1-LONG
The AUDJPY H1 chart shows a compelling setup for a buy position. A clear downtrend line has been broken, followed by a successful retest, indicating a potential reversal. The Ichimoku Cloud supports this bullish outlook, with price action breaking above the cloud, signaling a shift to bullish momentum. Additionally, the chart highlights a Wave N formation, a key pattern in wave theory, further confirming the bullish bias. The combination of the trendline break, retest, Ichimoku confirmation, and Wave N formation suggests a strong opportunity for a buy position.
If you liked this analysis, hit the BOOST !

Long buddy!!!Steady long bias for this pair
My macd, price action, divergence strategy have all been triggered.
What are your thoughts?
94.00-94.500 is my weekly target
Trade safely my friends

Bullish rise?AUD/JPY is reacting off the pivot and could rise to the 1st resistance, which aligns with the 61.8% Fibonacci retracement.
Pivot: 92.87
1st Support: 92.06
1st Resistance: 94.07
Risk Warning:
Trading Forex and CFDs carries a high level of risk to your capital and you should only trade with money you can afford to lose. Trading Forex and CFDs may not be suitable for all investors, so please ensure that you fully understand the risks involved and seek independent advice if necessary.
Disclaimer:
The above opinions given constitute general market commentary, and do not constitute the opinion or advice of IC Markets or any form of personal or investment advice.
Any opinions, news, research, analyses, prices, other information, or links to third-party sites contained on this website are provided on an "as-is" basis, are intended only to be informative, is not an advice nor a recommendation, nor research, or a record of our trading prices, or an offer of, or solicitation for a transaction in any financial instrument and thus should not be treated as such. The information provided does not involve any specific investment objectives, financial situation and needs of any specific person who may receive it. Please be aware, that past performance is not a reliable indicator of future performance and/or results. Past Performance or Forward-looking scenarios based upon the reasonable beliefs of the third-party provider are not a guarantee of future performance. Actual results may differ materially from those anticipated in forward-looking or past performance statements. IC Markets makes no representation or warranty and assumes no liability as to the accuracy or completeness of the information provided, nor any loss arising from any investment based on a recommendation, forecast or any information supplied by any third-party.

AUDJPY Swing BuysAUDJPY will continue to grow into June and possibly for the rest of June as well. An inverse head and shoulders pattern is forming on the daily chart.
