correction and fall predictedIn my mind the fall which has begun since 13 May needs a correction;Doesn't it?Then wait for it if did decide to get sell position
AUDJPY trade ideas

AUDJPY SHORT FORECAST Q2 W20 D15 Y25AUDJPY SHORT FORECAST Q2 W20 D15 Y25
Professional Risk Managers👋
Welcome back to another FRGNT chart update📈
Diving into some Forex setups using predominantly higher time frame order blocks alongside confirmation breaks of structure.
Let’s see what price action is telling us today!
💡Here are some trade confluences📝
✅Weekly order block rejection
✅Daily order block rejection
✅15' order block targets
✅Gap to be filled
🔑 Remember, to participate in trading comes always with a degree of risk, therefore as professional risk managers it remains vital that we stick to our risk management plan as well as our trading strategies.
📈The rest, we leave to the balance of probabilities.
💡Fail to plan. Plan to fail.
🏆It has always been that simple.
❤️Good luck with your trading journey, I shall see you at the very top.
🎯Trade consistent, FRGNT X

JPYAUD perfect long setupSuccessfully breakout this resistant line with a short -term target of at least +10%

AUD/JPY Struggles to Test March HighAUD/JPY snaps the series of higher highs and lows carried over from last week after struggling to test the March high (95.75).
In turn, AUD/JPY may continue to give back the advance from the start of the week, with a move/close below the 92.80 (50% Fibonacci extension) to 93.30 (23.6% Fibonacci extension) zone bringing the monthly low (91.42) on the radar.
Failure to defend the 91.50 (61.8% Fibonacci retracement) to 91.70 (38.2% Fibonacci extension) region opens up 90.50 (61.8% Fibonacci extension), but a breach above the March high (95.75) may push AUD/JPY back toward the February high (97.34).
--- Written by David Song, Senior Strategist at FOREX.com

AUDJPY Wave Analysis – 14 May 2025
- AUDJPY reversed from resistance area
- Likely to fall to support level 93.20
AUDJPY currency pair recently reversed from the resistance area between the key resistance level 95.30 (former monthly high from March), upper daily Bollinger Band and the 61.8% Fibonacci correction of the downward impulse wave (C) from November.
The downward reversal from this resistance area stopped the earlier short-term impulse wave 3 from the start of May.
Given the overbought daily Stochastic and strongly bullish yen sentiment, AUDJPY currency pair can be expected to fall to the next support level 93.20.

AUD-JPY Risky Short! Sell!
Hello,Traders!
AUD-JPY grew up fast
But then hit a horizontal
Resistance level of 95.750
From where we are already
Seeing a nice pullback
And we will be expecting
A further local move down
Sell!
Comment and subscribe to help us grow!
Check out other forecasts below too!
Disclosure: I am part of Trade Nation's Influencer program and receive a monthly fee for using their TradingView charts in my analysis.

AUDJPY SHORT FORECAST Q2 W20 D14 Y25AUDJPY SHORT FORECAST Q2 W20 D14 Y25
Professional Risk Managers👋
Welcome back to another FRGNT chart update📈
Diving into some Forex setups using predominantly higher time frame order blocks alongside confirmation breaks of structure.
Let’s see what price action is telling us today!
💡Here are some trade confluences📝
✅Weekly order block rejection
✅Daily order block rejection
✅15' order block targets
✅Gap to be filled
🔑 Remember, to participate in trading comes always with a degree of risk, therefore as professional risk managers it remains vital that we stick to our risk management plan as well as our trading strategies.
📈The rest, we leave to the balance of probabilities.
💡Fail to plan. Plan to fail.
🏆It has always been that simple.
❤️Good luck with your trading journey, I shall see you at the very top.
🎯Trade consistent, FRGNT X

AUDJPY DONE 30% "BUY"We expecting more buys on this pair after completing retracemen to a cheap price afford now look forward riding it to a higher price

AUD/JPY Short Bearish Trade Plan (Conservative Structure-Based Entry)
Entry: 92.40 (Sell Limit at resistance)
Stop Loss: 94.10 (Above weekly structure and fakeout buffer)
Take Profits:
TP1: 89.00 (initial neckline retest)
TP2: 85.50 (structure base)
TP3: 83.00 (macro extension target)

AUD/JPY For Bullishyou can long now
or
wait for pull-back near by entry point and then go long
general trend is up trend
have fun :)

AUDJPY is BearishPrice was in an uptrend, however now it seems that bulls are exhausted and bears are trying to assume control of the price action. A double top reversal pattern with bearish divergence is printed, and if previous higher low is broken then we can expect a bearish reversal as per Dow theory. Targets are mentioned on the chart.

AUDJPY – Short Trade ActiveAUDJPY – Short Trade Active
🔻 In a Sell | 🎯 Target: 94.32657 | ⏳ Intraday Outlook
Aiming for the level marked below, and keeping an eye on price behavior for confirmation along the way.
Should hit within 24 hours.
This is not financial advice. Just sharing what I’m doing.
💡 All trades can be replayed on TradingView for transparency.
#AUDJPY #ForexTrading #IntradaySetup #PriceAction #GlobalHorns #TradingView

AUDJPY – Bearish Drift Toward Double Target ZoneAUDJPY – Bearish Drift Toward Double Target Zone
🔻 Short Bias | 🎯 Targets: 91.85410 → 91.36166 | ⏳ Deadline: June
Price action looks heavy, and I’m aiming for both targets shown on the chart. I’ll be entering this trade as soon as the market opens.
If you’re joining me, just be prepared to hold for up to a week—this one may take time to develop.
This is not financial advice. I'm simply sharing how I’m positioning myself.
💡 All trades can be replayed on TradingView for review.
#AUDJPY #ShortSetup #ForexTrading #GlobalHorns #TradingView #BearishBias

AUD/JPY For Bullishwait for pull-back near by entry point and then go long
general trend is up trend
have fun :)

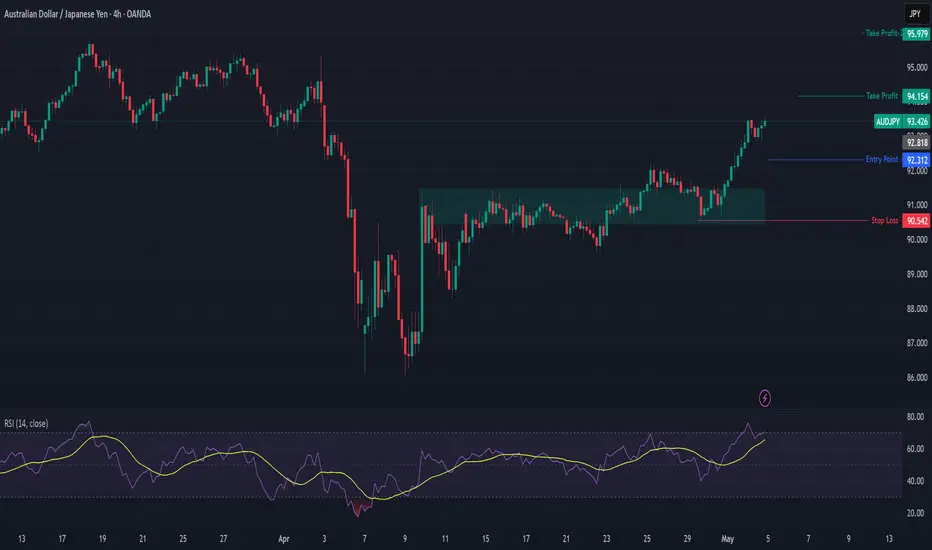
AUDJPY Trade Setup (Bullish Bias)🔥 Setup Summary:
Item Details
Bias: ✅ Bullish
Reasoning:
- Fundamentals strong (expectation no interest rate cuts + CPI bullish)
- JPY weak + overbought COT
- Exogenous: AUD strengthening
- Seasonality bearish short-term BUT medium-term bias bullish
Primary Entry: 🔑 92.30 (Buy Zone)
Dip Buy Zone: 🔄 91.80 – 92.00 (0.5–0.618 Fib retrace)
Stop Loss: 🚫 90.54 (below structure + 0.786 Fib)
Take Profit 1: 🎯 94.15 (below last swing high)
Take Profit 2: 🎯 95.00+ (extended target for trend continuation)
Risk:Reward: ~1:3+ (Entry at 92.3 / TP at 94.15–95.00)
AUDJPY –From Breakdown to Breakout Long Setup After Failed ShortFX:AUDJPY
The short idea was invalidated after price broke above the key resistance zone and hit our stop.
Now, we’re watching for a pullback to the broken zone for a potential long setup, supported by bullish momentum.
Keep it clean. Wait for confirmation.
Stay sharp, stay disciplined.
Smart Forex Analysis | Weekly Setups
Clean charts. No noise. Just levels.

AUDJPY - Bullish Double BottomHello Traders !
On Tuesday 6 May, The AUDJPY reached the support level (92.222 - 91.978).
The price formed a double bottom pattern.
At the moment, The Neckline is broken !
So, I expect a bullish move🚀
_______________
TARGET: 94.240🎯

AUDJPY BULLISH OR BEARISH DETAILED ANALYSISAUDJPY has successfully broken out of a long-term descending channel and is currently trading around 94.50. The breakout is clean and supported by solid bullish volume, which confirms that momentum is shifting in favor of the bulls. This setup indicates a clear trend reversal on the daily timeframe, and with the pair establishing higher lows and breaking resistance, the path toward 100.00 looks technically achievable in the coming weeks.
From a fundamental standpoint, the Australian dollar is gaining strength after the Reserve Bank of Australia (RBA) maintained a firm stance on inflation management. The latest CPI figures remain above the RBA’s comfort zone, and recent wage growth data has further reduced the probability of near-term rate cuts. Meanwhile, the Japanese yen continues to lag due to the Bank of Japan's ultra-loose monetary stance and consistent verbal intervention that lacks follow-through, keeping JPY broadly weaker across the board.
Technically, we’ve seen strong follow-through after the breakout, with price now holding firmly above prior resistance turned support. If this momentum sustains, we could see buyers step in aggressively, targeting 96.50 short-term and extending toward the key psychological level of 100.00 in the medium term. The risk-reward remains attractive with a clearly defined invalidation point below 91.00.
Overall, AUDJPY stands out as one of the most bullish JPY crosses on my radar. With a clean breakout, supportive fundamentals from the Australian side, and persistent weakness in the yen, this trade aligns with broader macro sentiment and could offer strong upside potential heading into the next quarter.

AUDJPY 4HHello traders! As you see we have BOS and Order Flow. In Supply zone you can see exactly RJB which collected liquidity and leave GAP(4H). Here I expecting reversal on LTF = GAP + 0.5 Supply.
Have a profitable day!

AUDJPY Breakout on Rising Yields – Path Open to 95.70AUDJPY is maintaining strong bullish structure after breaking through key resistance around 91.65. Price is forming higher lows supported by an ascending trendline, indicating healthy buyer momentum. Fibonacci retracement levels show price holding above the 50% and 61.8% zones, strengthening the bullish case.
🔑 Key Levels:
Current Price: 91.65
Support Zone: 90.85 – 91.00 (previous structure + fib support)
Resistance Targets:
TP1: 93.15 (previous swing high)
TP2: 95.70 (full recovery move from March highs)
✅ Bullish Confluence Factors:
Ascending triangle breakout in progress
Strong higher lows and clean market structure
Holding above major 61.8% Fib retracement
Australian dollar supported by improved risk sentiment globally
BOJ expected to stay dovish and delay hikes, keeping the yen weak
🧠 Fundamental Context:
Japan Outlook: BOJ to hold rates steady at 0.5% amid US tariff risks. IMF projects a downgrade in Japan’s growth, weakening JPY outlook.
Sentiment on JPY: No strong intervention support for yen despite media noise. Japan’s government denied any push for stronger yen.
Australia Outlook: Risk sentiment steady, equities firmer globally, and higher AUD correlations to risk-on tone favor upside continuation.
💡 Trade Idea:
Bias: Bullish above 91.00
Entry: On confirmation bounce above 91.60
Target 1: 93.15
Target 2: 95.70
Stop Loss: Below 90.50
📌 Note: Watch for possible mild pullback into 91.30-91.50 zone before new upside leg. Strong US data midweek could temporarily lift JPY but broader BOJ dovishness remains the driver.

AUD/JPY SELLERS WILL DOMINATE THE MARKET|SHORT
Hello, Friends!
The BB upper band is nearby so AUD-JPY is in the overbought territory. Thus, despite the uptrend on the 1W timeframe I think that we will see a bearish reaction from the resistance line above and a move down towards the target at around 90.143.
Disclosure: I am part of Trade Nation's Influencer program and receive a monthly fee for using their TradingView charts in my analysis.
✅LIKE AND COMMENT MY IDEAS✅

Possible Next Move AUD JPYLooking at the Daily & 1HR Chart. Bearish trend over all. Likely to take out the Daily FVG to head down to the next significant price zone of 86.981. This area also shows a 1HR liquidity zone.

AUDJPY SHORT FORECAST Q2 W19 D9 Y25AUDJPY SHORT FORECAST Q2 W19 D9 Y25
Professional Risk Managers👋
Welcome back to another FRGNT chart update📈
Diving into some Forex setups using predominantly higher time frame order blocks alongside confirmation breaks of structure.
Let’s see what price action is telling us today!
💡Here are some trade confluences📝
✅Weekly order block rejection
✅Daily order block rejection
✅15' order block targets
✅Weekly imbalance fill targets
🔑 Remember, to participate in trading comes always with a degree of risk, therefore as professional risk managers it remains vital that we stick to our risk management plan as well as our trading strategies.
📈The rest, we leave to the balance of probabilities.
💡Fail to plan. Plan to fail.
🏆It has always been that simple.
❤️Good luck with your trading journey, I shall see you at the very top.
🎯Trade consistent, FRGNT X
