AUDJPY POTENTIAL SELL ANALYSIS !OTE ZONE !
I am looking for AUD to push up and find previous resistance! To SELL off of 🛑
In confluence with my Fibonacci Zone .. 0.69
When level reached , looking for an entry off of a smaller timeframe ‼️‼️
AUDJPY trade ideas

Agood BUIYHTF structure bullish, price createing an engineered liquidity before the first sweep, price is expected to mitigate the engineeered liquidity. Current order flow bullish, Price coming to react to a protected zone with liquidity.

AUDJPY: Bullish Continuation & Long Signal
AUDJPY
- Classic bullish formation
- Our team expects growth
SUGGESTED TRADE:
Swing Trade
Buy AUDJPY
Entry Level - 93.633
Sl - 93.123
Tp - 94.417
Our Risk - 1%
Start protection of your profits from lower levels
Disclosure: I am part of Trade Nation's Influencer program and receive a monthly fee for using their TradingView charts in my analysis.
❤️ Please, support our work with like & comment! ❤️

Bullish bounce?AUD/JPY has bounced of the pivot and could potentialy rise to the 1st resistance.
Pivot: 92.28
1st Support: 92.68
1st Resistance: 94.19
Risk Warning:
Trading Forex and CFDs carries a high level of risk to your capital and you should only trade with money you can afford to lose. Trading Forex and CFDs may not be suitable for all investors, so please ensure that you fully understand the risks involved and seek independent advice if necessary.
Disclaimer:
The above opinions given constitute general market commentary, and do not constitute the opinion or advice of IC Markets or any form of personal or investment advice.
Any opinions, news, research, analyses, prices, other information, or links to third-party sites contained on this website are provided on an "as-is" basis, are intended only to be informative, is not an advice nor a recommendation, nor research, or a record of our trading prices, or an offer of, or solicitation for a transaction in any financial instrument and thus should not be treated as such. The information provided does not involve any specific investment objectives, financial situation and needs of any specific person who may receive it. Please be aware, that past performance is not a reliable indicator of future performance and/or results. Past Performance or Forward-looking scenarios based upon the reasonable beliefs of the third-party provider are not a guarantee of future performance. Actual results may differ materially from those anticipated in forward-looking or past performance statements. IC Markets makes no representation or warranty and assumes no liability as to the accuracy or completeness of the information provided, nor any loss arising from any investment based on a recommendation, forecast or any information supplied by any third-party.

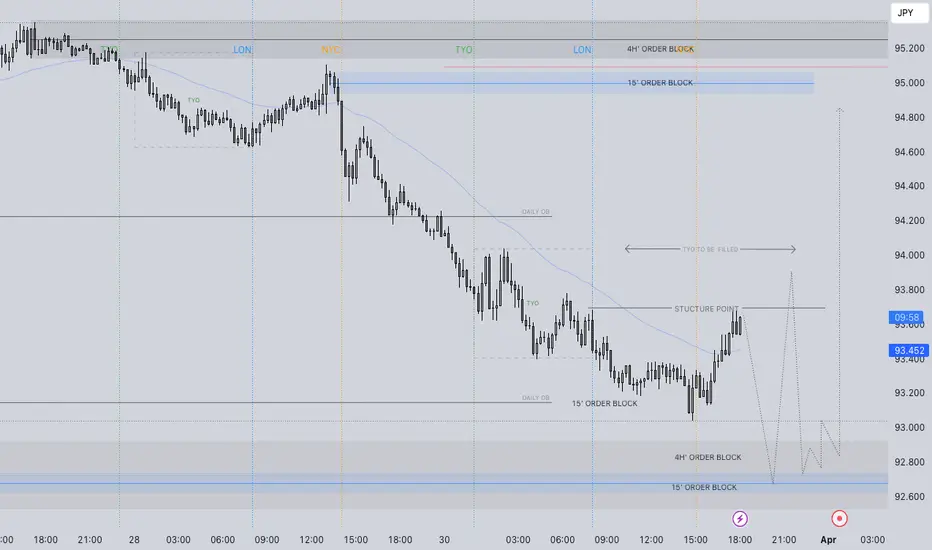
AUDJPY Monday 31st March 2025 Neu bias.AUDJPY Monday 31st March 2025 Neu bias.
The setup that aligns with the majority of the confluences IMO would be the short position. I've time to discus this pair as price actions needs to work prior any involvement. Since current price action is closer to the long point of interest, let's discuss.
Work needs to he done. What I'd like to see is penetration of the 4h 15' OB. Ideally this would happen prior the Break of 15' structure. As per the image, it doesn't seem like that particular set up will occur first. In any case, we need to see both before risking capital. Once 4h 15' Order block is mitigated, I will then only consider the long position upon a lower time frame break of structure. To the speculator, it is a lot of waiting and waiting for particular things however what better to await price to come to you and journal the potential set up in the mean time.
post 1'/5' turn around in price - I will then have the confidence, confluence and confirmation that the position has enough buying pressure to take me to my management point.
In contrast, a trade that I'd happily wait for without taking the long to the point of interest would be the short. Why? The weekly and daily 50 exponential moving average. I would essentially be awaiting the same confluences as with the long position but in the short direction. in addition, with the 50 weekly/daily coming down to join the short party, I will accept a lower time frame break of structure as confluence to grab the short as apposed to waiting for a 15' break of structure first.
What do you think? Let's see how the markets play out.
FRGNT
audjpyAudjpy seems to be in a minor downtrend, Any pullback I will look for sell until breaking the lows. Then see how the market behaves after that

AUDJPY SELLSOANDA:AUDJPY can definitely sell off to the 93.250 area. Daily double top, daily 61.8% retracement and H1 support broken. I'd look for price to make another LH before entering sells.

BUY AUD/JPYAUD/JPY is at a key area of resistance/support and shows strong signs of a reversal into consolidation.

Audjpy Short Setup - RSTRADINGMarket Overview:
AUDJPY is currently in a daily bearish trend, rejecting a key resistance level and forming a potential lower high. The price has failed to break above a strong resistance zone around 95.151, respecting the trendline and forming a Break of Structure (BOS) on the 4-hour timeframe.
Technical Breakdown:
Trend: Bearish (Daily and 4H)
Resistance Zone: 95.151
Break of Structure (BOS): Confirmed, signaling bearish continuation
Liquidity (LIQ$): Below recent lows, where sellers are likely targeting
50% of Previous Daily Candle: Acting as a key level for potential short entries
Risk-to-Reward (R:R): 1:6 potential trade setup
Trade Plan:
📉 Short Entry: After a potential pullback to the 50% of previous daily candle or a minor retest of the recent structure break.
🎯 Target: Major liquidity zone around 91.822 - 92.516
🛑 Stop Loss: Above 95.151 resistance zone
Confluence Factors:
✅ Trendline rejection - Price respecting the descending trendline
✅ Bearish structure confirmed - BOS indicates continuation to the downside
✅ Liquidity grab expected - Targeting liquidity at the lower key levels
🔎 Overall Bias: Bearish with a high-probability short setup. Watching for a possible retracement before continuation to downside.
precise entry to buy we have good confirmation and strength to buy AUDJPY ,a good precise entry to buy happy trading

AUDJPY This Golden Cross is the signal for selling.The AUDJPY pair gave us last time (February 19, see chart below) an excellent sell signal that easily hit our 93.750 Target and bottom of the Bearish Megaphone:
The market is about to complete a 4H Golden Cross and last time it did (January 07 2025), it formed a Top. That was also after a Channel Up that started following an almost -6% decline. Notice how the 1D RSI patterns among the two fractals are similar.
The bearish sequence that followed the previous 4H Golden Cross hit the 1.236 Fibonacci extension. As a result, we expect to see 91.000 by May.
-------------------------------------------------------------------------------
** Please LIKE 👍, FOLLOW ✅, SHARE 🙌 and COMMENT ✍ if you enjoy this idea! Also share your ideas and charts in the comments section below! This is best way to keep it relevant, support us, keep the content here free and allow the idea to reach as many people as possible. **
-------------------------------------------------------------------------------
Disclosure: I am part of Trade Nation's Influencer program and receive a monthly fee for using their TradingView charts in my analysis.
💸💸💸💸💸💸
👇 👇 👇 👇 👇 👇

4-hr AUD/JPY: The Pair on Track for a Potential 150 pips Gain The AUD/JPY currency pair continues to be dominated by bullish momentum, as multiple golden cross patterns reaffirm the strength of the ongoing uptrend. Despite this, we are witnessing a much-needed correction that began yesterday, bringing the pair down by approximately 60 pips. This retracement is a natural part of market cycles, allowing the pair to consolidate before potentially resuming its upward trajectory.
At this point, we expect the pullback to extend further, aiming for an additional 30-pip decline before considering a buy entry. The key level to watch is 94.50, which serves as a critical buying zone due to its alignment with the 38% Fibonacci retracement level. Historically, this area has acted as a strong support, preventing deeper declines and often triggering rebounds. Given its significance, we anticipate a renewed wave of buying pressure once the price reaches this level, making it an ideal entry point for a long position.
Our trade strategy involves setting a profit target at 96.00, ensuring a favorable risk-to-reward ratio. Meanwhile, to protect against unexpected volatility, our stop-loss (SL) will be placed 1.2% below the entry price. This cautious approach allows us to manage risk effectively while capitalizing on the broader bullish trend.
The presence of golden cross patterns further reinforces our bullish outlook, as they indicate strong underlying momentum. By patiently waiting for the correction to complete, we increase the probability of entering the trade at an optimal price, maximizing potential gains. Thus, we remain on standby, ready to initiate our buy order once the market reaches our predetermined entry zone at 94.50.

28.03.25 Morning ForecastPairs on Watch -
FX:EURAUD
FX:AUDJPY
A short overview of the instruments I am looking at for today, multi-timeframe analysis down to what I will be looking at for an entry. Enjoy!

AUD/JPY 1D possible scenario Technical Analysis 1D
The pair is testing a long-term downtrend resistance. A breakout could signal further upside.
Key Levels:
Support: 95.52
Resistance: 98.49 | 102.62 | 109.40
Fundamental Factors:
Australian Dollar Strength: Driven by commodity demand and potential RBA rate decisions.
Japanese Yen Weakness: BoJ’s ultra-loose policy keeps the yen under pressure.
Risk Sentiment: AUD/JPY correlates with market risk appetite; stronger equities could support upside.
A breakout above 95.52 may open the path toward 98.49.

AUDJPY INTRADAY resistance retest at 95.70Key Trading Level: 95.70
Bearish Scenario:
The overall sentiment remains bearish, aligned with the longer-term prevailing downtrend. Recent price action suggests a sideways consolidation, indicating potential continuation of the downtrend. A bearish rejection from 95.70 could reinforce selling pressure, targeting 94.20 as the first support level, with further downside extending toward 93.30 and 92.60 if bearish momentum strengthens.
Bullish Scenario:
A confirmed breakout above 95.70 and a daily close higher would invalidate the bearish outlook, signaling a potential shift in momentum. If buyers gain control, the next upside targets would be 96.20, followed by 96.80, where further resistance may emerge.
Conclusion:
The 95.70 level is a key pivot point in determining AUDJPY’s next directional move. A rejection at this level would reinforce the bearish outlook, while a breakout higher could indicate a potential trend reversal. Traders should monitor price action around 95.70 for confirmation of the next move.
This communication is for informational purposes only and should not be viewed as any form of recommendation as to a particular course of action or as investment advice. It is not intended as an offer or solicitation for the purchase or sale of any financial instrument or as an official confirmation of any transaction. Opinions, estimates and assumptions expressed herein are made as of the date of this communication and are subject to change without notice. This communication has been prepared based upon information, including market prices, data and other information, believed to be reliable; however, Trade Nation does not warrant its completeness or accuracy. All market prices and market data contained in or attached to this communication are indicative and subject to change without notice.

AUDJPY Technical Analysis! SELL!
My dear friends,
Please, find my technical outlook for AUDJPY below:
The instrument tests an important psychological level 95.011
Bias - Bearish
Technical Indicators: Supper Trend gives a precise Bearish signal, while Pivot Point HL predicts price changes and potential reversals in the market.
Target - 94.381
About Used Indicators:
Super-trend indicator is more useful in trending markets where there are clear uptrends and downtrends in price.
Disclosure: I am part of Trade Nation's Influencer program and receive a monthly fee for using their TradingView charts in my analysis.
———————————
WISH YOU ALL LUCK

AUD/JPY For Bullishwait for pull-back near by entry point and then go long
general trend is up trend
JPY is Weak
have fun :)

15 minute trendline breakThe price has broken a 15 minute trendline, followed by a pullback, now the price looks to go bullish after making a higher high
WE ONLY TRADE PULLBACKS

Bullish bounce?AUD/JPY is falling towards the pivot which acts as a pullback support and could bounce to the 1st resistance.
Pivot: 94.04
1st Support: 93.18
1st Resistance: 95.54
Risk Warning:
Trading Forex and CFDs carries a high level of risk to your capital and you should only trade with money you can afford to lose. Trading Forex and CFDs may not be suitable for all investors, so please ensure that you fully understand the risks involved and seek independent advice if necessary.
Disclaimer:
The above opinions given constitute general market commentary, and do not constitute the opinion or advice of IC Markets or any form of personal or investment advice.
Any opinions, news, research, analyses, prices, other information, or links to third-party sites contained on this website are provided on an "as-is" basis, are intended only to be informative, is not an advice nor a recommendation, nor research, or a record of our trading prices, or an offer of, or solicitation for a transaction in any financial instrument and thus should not be treated as such. The information provided does not involve any specific investment objectives, financial situation and needs of any specific person who may receive it. Please be aware, that past performance is not a reliable indicator of future performance and/or results. Past Performance or Forward-looking scenarios based upon the reasonable beliefs of the third-party provider are not a guarantee of future performance. Actual results may differ materially from those anticipated in forward-looking or past performance statements. IC Markets makes no representation or warranty and assumes no liability as to the accuracy or completeness of the information provided, nor any loss arising from any investment based on a recommendation, forecast or any information supplied by any third-party.

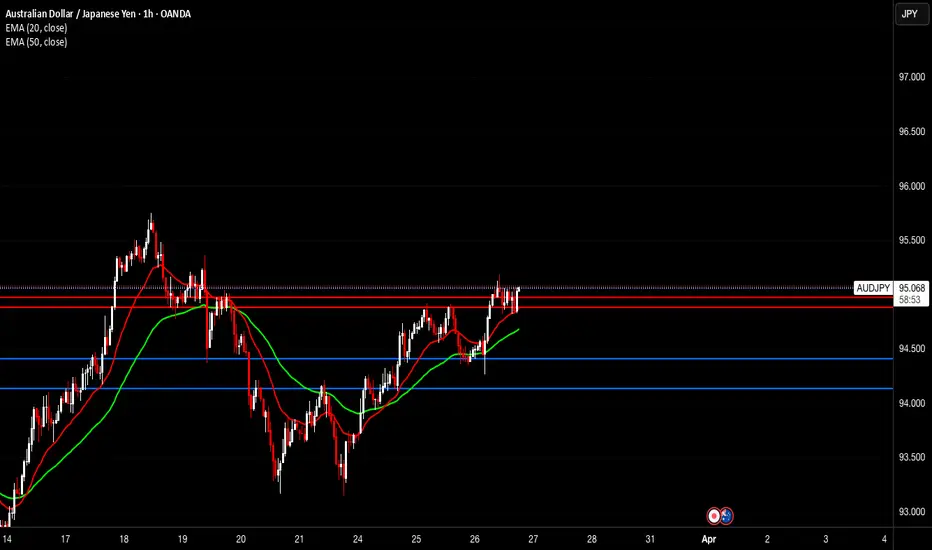
AUDJPYPrice is above the weekly zone and has retested on the daily and H4. Was waiting for break above h1 resistance which has happened with a retest. looks ripe for upward movement.
AUD/JPY SELL IDEA (R:R=8.7)Selling AUD/JPY now. I have been waiting for this to close below the trend line. Overall direction is BEARISH according to Monthly timeframe.
Stop Loss is: 95.260
Please move SL to break even when trade is 70+ pips in profit.
1st Target: 93.500
2nd Target: 92.715
Happy Trading! :)

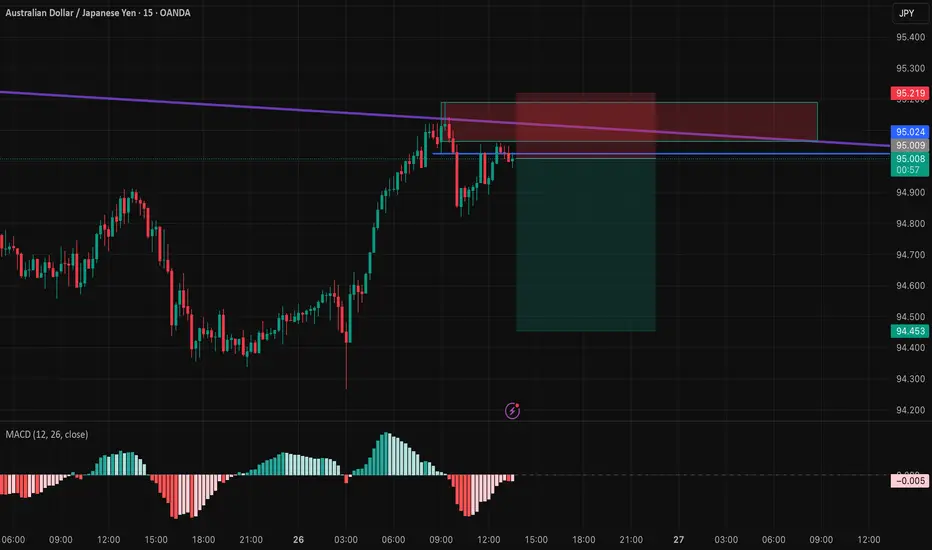
AUDJPY 15 min Short IdeaHello Friends,
AUDJPY is finding resistance and is about to resume its downtrend.
ENTRY = Market Price
SL = 95.22
TP = 94.45
Kindly share your views and please like, share, and follow for more ideas.
Thanks
The Journey has come to an end: AUDJPY hit TP, after 3 dayswe started the journey on Monday, London session, we held it no matter the market conditions.
we believed in our setup and we hit our TP.
cheers to y'all that followed it.
unto the next, let's fvcking goooo!!!
