AUDJPY The Week Ahead 10th March ‘25. Key Trading Level: 94.70
Bearish Scenario:
The overall sentiment remains bearish, aligned with the longer-term prevailing downtrend. Recent price action suggests a sideways consolidation, indicating potential continuation of the downtrend. A bearish rejection from 94.70 could reinforce selling pressure, targeting 92.33 as the first support level, with further downside extending toward 91.18 and 89.60 if bearish momentum strengthens.
Bullish Scenario:
A confirmed breakout above 94.70 and a daily close higher would invalidate the bearish outlook, signaling a potential shift in momentum. If buyers gain control, the next upside targets would be 95.56, followed by 96.60, where further resistance may emerge.
Conclusion:
The 94.70 level is a key pivot point in determining AUDJPY’s next directional move. A rejection at this level would reinforce the bearish outlook, while a breakout higher could indicate a potential trend reversal. Traders should monitor price action around 94.70 for confirmation of the next move.
This communication is for informational purposes only and should not be viewed as any form of recommendation as to a particular course of action or as investment advice. It is not intended as an offer or solicitation for the purchase or sale of any financial instrument or as an official confirmation of any transaction. Opinions, estimates and assumptions expressed herein are made as of the date of this communication and are subject to change without notice. This communication has been prepared based upon information, including market prices, data and other information, believed to be reliable; however, Trade Nation does not warrant its completeness or accuracy. All market prices and market data contained in or attached to this communication are indicative and subject to change without notice.
AUDJPY trade ideas

Head and shoulders patternThe price has formed a pattern followed by an attempted breakout then pullback and now a breakout, time to go short
WE ONLY TRADE PULLBACKS
AUDJPY BEARISHMy various forms of analysis, which always include a quantitative outlook, indicate that the bearish momentum should continue up to the marked price. This outlook is for the long term.


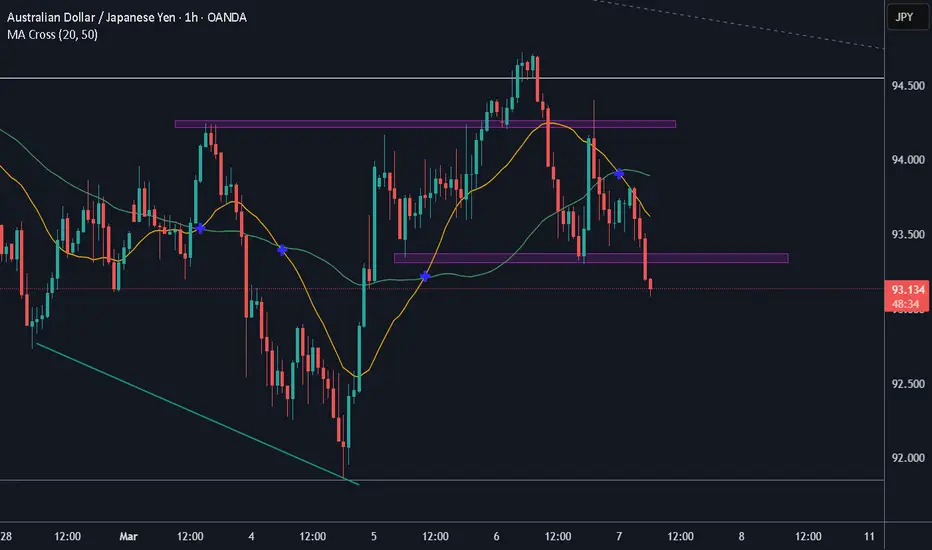
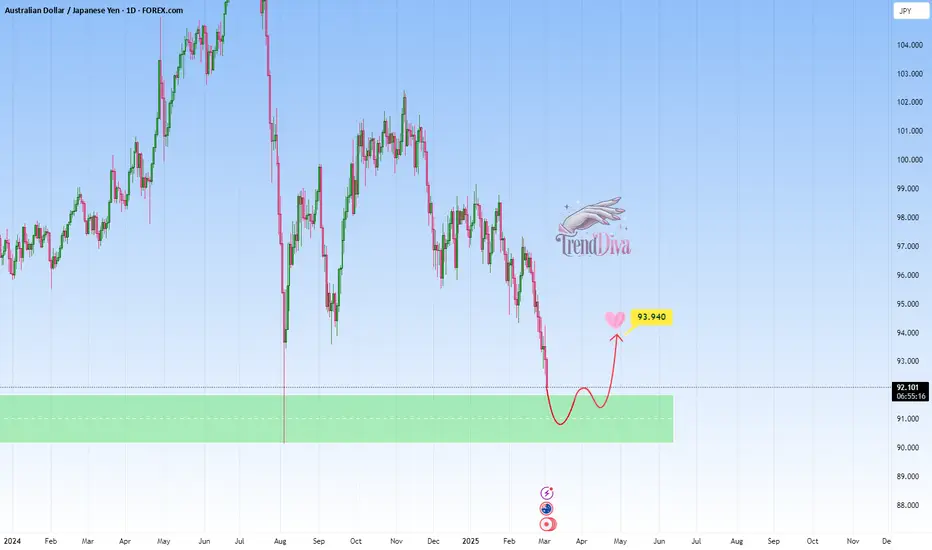
AUDJPY Approaching Key Support - Will Price Rebound to 93.940?OANDA:AUDJPY is approaching a key support level, an area where buyers have previously shown strong interest. The recent bearish movement suggests that price may soon be testing this level, potentially setting up for a rebound.
A bullish confirmation, such as a strong rejection pattern, bullish engulfing candles, or long lower wicks, would strengthen the case for a move higher. If buyers step in, the price could rally toward 93.940, aligning with the next key resistance level.
However, a decisive breakdown below this support would invalidate the bullish scenario and could lead to further downside.
This is not financial advice but rather how I approach support/resistance zones. Remember, always wait for confirmation, like a rejection candle or volume spike before jumping in.
Best of luck, TrendDiva.
AUDJPY - potential SHORT trade with 2 potential targetsHigher timeframe trend = down
Retail traders = long
JPY = Strong, AUD = Weak
Therefore bias = down
NOTE : Not in yet - Entry order set below the structure that is forming currently.
A decent level of structure was broken to the left (marked with red horizontal ray) so I believe more downside is incoming (potentially all the way to the white horizontal ray which marks lows created back in August 24)
Target is a distance above to low that was created in August 24 (marked with white dotted horizontal ray) - these lows might be a decent 2nd target for anyone who trades extended targets. I personally do not.
Stops where my personal backtesting has suggested they be placed to invalidate the trade. If price gets to stops before triggering in, entry order is cancelled.
Please keep in mind that there is another layer of analysis that goes into this that is part of my personal plan.

AUD/JPY Trade Analysis – 15-Minute ChartMarket Overview
The AUD/JPY currency pair is exhibiting a bearish trend on the 15-minute timeframe, with price action remaining below the 9-period EMA, signaling continued downside momentum.
Trade Setup
Entry Price: 93.525
Stop Loss (SL): 93.902 (above the entry, marked in red)
Take Profit (TP): 91.790 (marked in green)
Risk-Reward Ratio: Favorable, with a larger potential reward compared to the risk.
Technical Outlook
The market is in a downtrend, confirmed by lower highs and lower lows.
Price has briefly retraced but remains below the 9 EMA, indicating that bearish momentum is intact.
A break below the recent low could accelerate selling pressure towards the 91.790 target.
Trade Scenarios
✅ Bearish Continuation: If the price respects the trend and moves downward, the trade is likely to reach TP.
❌ Bullish Invalidation: A break above 93.902 (SL level) would invalidate the trade, signaling a shift in momentum.
📌 Conclusion: This trade setup aligns with the ongoing bearish trend, offering a high-probability opportunity with a well-defined risk-to-reward ratio.

AUDJPY 4000K PROFIT CLOSING FOR NFP LIVE TRADE UPDATEThe recent weakness in AUD/JPY can be attributed to a combination of factors, including:
Increased risk aversion, leading to a stronger Yen.
Potential divergences in central bank policies.
Concerns about the Australian economic outlook.
Bearish technical analysis.

audjpy sell tradeThe Relative Strength Index (RSI) is showing a downward trend, indicating weakening momentum. Additionally, the Moving Average Convergence Divergence (MACD) is showing a bearish crossover, further supporting the potential for a downward move

AUD/AJPY change of structure updateCurrently you could see how this pair have slowly unraveled. It’s still respecting the red curved line ( look at my previous analysis) it did a pullback from exhaustion for the last two days. Then went bearish this morning which means market first sentiment is shorts. Pull back up touching past fib 6.18 and resume to moving lower ( possibly a liquidity grab). Higher time frame price action still remain bearish. At the moment it looks like a head and shoulder is in the making ( A bearish top pattern close to the red curved line that acted as strong resistance barrier).
Wait for price to show its hand and only place shorts after head and shoulder fully develops, breaks below neckline and close with a confirmation.
May the patient trader win

AUD/JPY down trend resume potential As you can see the pull back from previous down trend seems to be exhausted from bears pushing back hard. Wait for candle to break below the low of previous bullish candle and wait for rejection or pull back before entering shorts. Wait for the right timing to surf with the trend

AUDJPY LongPrice is at daily support with and I entered on the bullish engulfing candle. Targeting a 1:3RR.

AUDJPY Capped by resistance at 94.70Key Trading Level: 94.70
Bearish Scenario:
The overall sentiment remains bearish, aligned with the longer-term prevailing downtrend. Recent price action suggests a sideways consolidation, indicating potential continuation of the downtrend. A bearish rejection from 94.70 could reinforce selling pressure, targeting 92.33 as the first support level, with further downside extending toward 91.18 and 89.60 if bearish momentum strengthens.
Bullish Scenario:
A confirmed breakout above 94.70 and a daily close higher would invalidate the bearish outlook, signaling a potential shift in momentum. If buyers gain control, the next upside targets would be 95.56, followed by 96.60, where further resistance may emerge.
Conclusion:
The 94.70 level is a key pivot point in determining AUDJPY’s next directional move. A rejection at this level would reinforce the bearish outlook, while a breakout higher could indicate a potential trend reversal. Traders should monitor price action around 94.70 for confirmation of the next move.
This communication is for informational purposes only and should not be viewed as any form of recommendation as to a particular course of action or as investment advice. It is not intended as an offer or solicitation for the purchase or sale of any financial instrument or as an official confirmation of any transaction. Opinions, estimates and assumptions expressed herein are made as of the date of this communication and are subject to change without notice. This communication has been prepared based upon information, including market prices, data and other information, believed to be reliable; however, Trade Nation does not warrant its completeness or accuracy. All market prices and market data contained in or attached to this communication are indicative and subject to change without notice.

AUDJPY SHORT 900PIPS MOVE CAUGHT LIVE TRADE UPDATECentral Bank Policy Divergence:
The Bank of Japan (BOJ) is showing signs of shifting its monetary policy, with increasing expectations of potential interest rate hikes. This strengthens the Japanese Yen (JPY).
Conversely, the Australian Dollar (AUD) is affected by the Reserve Bank of Australia's (RBA) policy, and any indications of potential rate cuts or a more dovish stance weakens the AUD.


AUDJPY BUYAUDJPY is gearing up for a bullish retracement. Should price reach 93,130 I will be buying and make some profit. I will take profit at the resistance 95,444

audjpy buy signal. Don't forget about stop-loss.
Write in the comments all your questions and instruments analysis of which you want to see.
Friends, push the like button, write a comment, and share with your mates - that would be the best THANK YOU.
P.S. I personally will open entry if the price will show it according to my strategy.
Always make your analysis before a trade

Trendline breakThe price broke a bearish trendline followed by a pullback, now the price has made a higher high, time to go long
WE ONLY TRADE PULLBACKS

Could the price rise from here?AUD/JPY is reacting off the pivot which has been identified as a pullback support and could rise to the 1st resistance which is an overlap resistance.
Pivot: 94.11
1st Support: 92.82
1st Resistance: 95.29
Risk Warning:
Trading Forex and CFDs carries a high level of risk to your capital and you should only trade with money you can afford to lose. Trading Forex and CFDs may not be suitable for all investors, so please ensure that you fully understand the risks involved and seek independent advice if necessary.
Disclaimer:
The above opinions given constitute general market commentary, and do not constitute the opinion or advice of IC Markets or any form of personal or investment advice.
Any opinions, news, research, analyses, prices, other information, or links to third-party sites contained on this website are provided on an "as-is" basis, are intended only to be informative, is not an advice nor a recommendation, nor research, or a record of our trading prices, or an offer of, or solicitation for a transaction in any financial instrument and thus should not be treated as such. The information provided does not involve any specific investment objectives, financial situation and needs of any specific person who may receive it. Please be aware, that past performance is not a reliable indicator of future performance and/or results. Past Performance or Forward-looking scenarios based upon the reasonable beliefs of the third-party provider are not a guarantee of future performance. Actual results may differ materially from those anticipated in forward-looking or past performance statements. IC Markets makes no representation or warranty and assumes no liability as to the accuracy or completeness of the information provided, nor any loss arising from any investment based on a recommendation, forecast or any information supplied by any third-party.

AUDJPYAUDJPY showed a strong impulsive move, followed by a consolidation phase, signaling a potential accumulation. Now, the pair is breaking out and pushing higher, confirming bullish momentum with buyers regaining control. A continuation toward key resistance levels is likely if momentum sustains.

AUD/JPY potential shortYesterday AUD/JPY was bullish after a couple weeks of bearish run. Long term price action is still bearish and it’s still respecting the curve. Before placing any position for shorts make sure to wait for price action to confirm with a rejection candle ( long wick, rejection, or engulfing candle or another lower low) before placing a bearish trade. Remember to never chase a trade

AUDJPY bullish continuation to expect
OANDA:AUDJPY trend based analysis, we are can see price is make break of zone on 11.Feb, its make strong bullish push, price is also break and CHANNEL pattern, currently price is on valid sup zone, technicals are strong bullish also. Personally here strong bullish expectations.
SUP zone: 96.200
RES zone: 98.100, 98.600

AUDJPYSeveral economic data releases can influence the AUD/JPY currency pair. Here are some key upcoming data points:
Australian Economic Data:
GDP Growth: A strong GDP report can boost AUD by indicating a robust economy, while a weak report might weaken AUD.
Inflation Rate: Changes in inflation can influence the Reserve Bank of Australia's (RBA) monetary policy decisions, impacting AUD.
Employment Data: Strong employment figures can support AUD by indicating a healthy labor market.
Japanese Economic Data:
Inflation Rate: Japan's inflation rate impacts the Bank of Japan's (BOJ) policy decisions, affecting JPY.
BOJ Monetary Policy Decisions: Any changes in interest rates or quantitative easing can significantly impact JPY.
Unemployment Rate: Unexpected changes in the unemployment rate can influence JPY by affecting economic outlooks.
Global Economic Indicators:
US Economic Data: Strong US data can influence global risk appetite, impacting both AUD and JPY.
China's Economic Performance: As Australia's largest trading partner, China's economic health affects AUD.
Impact on AUD/JPY Trade Directional Bias
AUD Strength: Positive Australian economic data, such as strong GDP growth or low unemployment, can strengthen AUD against JPY.
JPY Strength: Positive Japanese economic data or a dovish stance from the RBA can strengthen JPY against AUD.
Risk Sentiment: AUD/JPY is sensitive to global risk sentiment. During risk-off periods, JPY tends to strengthen, while AUD weakens.
Trading Strategy:
Long AUD/JPY: If Australian economic data is strong and Japanese data is weak, or if global risk sentiment improves.
Short AUD/JPY: If Australian data is weak and Japanese data is strong, or if global risk sentiment deteriorates.
Recent Developments:
Hawkish BOJ Sentiment: Expectations of further interest rate hikes by the BOJ have strengthened JPY, impacting AUD/JPY negatively.
Tariff Concerns: Growing concerns about a global tariff war have also pressured AUD/JPY, as AUD is sensitive to trade tensions involving China
