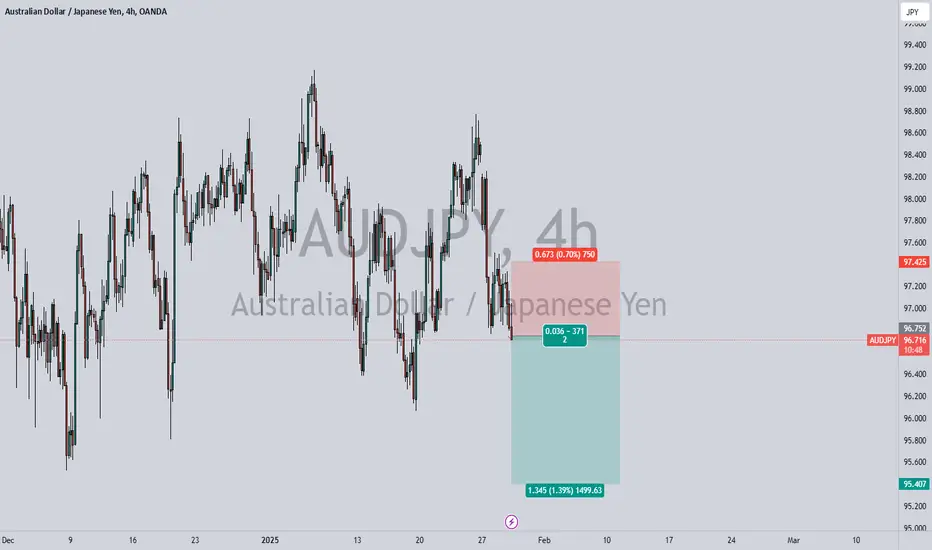
AUDJPY sellBrocken consolidation and downtrend overall
sellers in the market with volume
going to the next liquidity magnet
AUDJPY trade ideas

AudJpygreat set up for a sell..
support broken, now retested that point and of course fibo zone 61.80
now will wait for bearish candle to break the trend and to go for a sell..
lets see, GL...

AUDJPYAUDJPY is in declining phase.
Potentially printing LH and LL.
No sign of reversal here.
Alligator also indicates that trend will go down.
We sell at CMP.

AUDJPY My Opinion! BUY!
My dear subscribers,
AUDJPY looks like it will make a good move, and here are the details:
The market is trading on 95.481 pivot level.
Bias - Bullish
My Stop Loss - 94.973
Technical Indicators: Both Super Trend & Pivot HL indicate a highly probable Bullish continuation.
Target - 96.280
About Used Indicators:
The average true range (ATR) plays an important role in 'Supertrend' as the indicator uses ATR to calculate its value. The ATR indicator signals the degree of price volatility.
———————————
WISH YOU ALL LUCK

Sell ActivatedGod First
Minimum Risk Maximum Reward
Action Backed Believe
# faith, strategy, and execution all in one #

AUDJPY Daily Chart Bullish Divergence
AUDJPY has seen continual bullish divergence for over 1 month now.
What are your thoughts on the bullish order block in the chart from recent days and a similar price? Feel free to comment.

audjpy buy tradeThe Relative Strength Index (RSI) is showing an upward trend, indicating increasing momentum. Additionally, the Moving Average Convergence Divergence (MACD) is showing a bullish crossover, further supporting the potential for an upward move.

resumption of dountrendBased on the pivot point at 97,071, I expect a potential bearish level. If that level is broken, a drop to 91,781 seems like the next potential target based on the analysis. Are you looking at this from a technical analysis perspective, such as using support/resistance or trend lines, or are there any other indicators you factor into your view?

AUD/JPY H4 | Rising into overlap resistanceAUD/JPY is rising towards an overlap resistance and could potentially reverse off this level to drop lower.
Sell entry is at 96.78 which is an overlap resistance that aligns with the 50.0% Fibonacci retracement level.
Stop loss is at 97.60 which is a level that sits above the 61.8% Fibonacci retracement and a pullback resistance.
Take profit is at 95.64 which is an overlap support.
High Risk Investment Warning
Trading Forex/CFDs on margin carries a high level of risk and may not be suitable for all investors. Leverage can work against you.
Stratos Markets Limited (www.fxcm.com):
CFDs are complex instruments and come with a high risk of losing money rapidly due to leverage. 63% of retail investor accounts lose money when trading CFDs with this provider. You should consider whether you understand how CFDs work and whether you can afford to take the high risk of losing your money.
Stratos Europe Ltd (www.fxcm.com):
CFDs are complex instruments and come with a high risk of losing money rapidly due to leverage. 63% of retail investor accounts lose money when trading CFDs with this provider. You should consider whether you understand how CFDs work and whether you can afford to take the high risk of losing your money.
Stratos Trading Pty. Limited (www.fxcm.com):
Trading FX/CFDs carries significant risks. FXCM AU (AFSL 309763), please read the Financial Services Guide, Product Disclosure Statement, Target Market Determination and Terms of Business at www.fxcm.com
Stratos Global LLC (www.fxcm.com):
Losses can exceed deposits.
Please be advised that the information presented on TradingView is provided to FXCM (‘Company’, ‘we’) by a third-party provider (‘TFA Global Pte Ltd’). Please be reminded that you are solely responsible for the trading decisions on your account. There is a very high degree of risk involved in trading. Any information and/or content is intended entirely for research, educational and informational purposes only and does not constitute investment or consultation advice or investment strategy. The information is not tailored to the investment needs of any specific person and therefore does not involve a consideration of any of the investment objectives, financial situation or needs of any viewer that may receive it. Kindly also note that past performance is not a reliable indicator of future results. Actual results may differ materially from those anticipated in forward-looking or past performance statements. We assume no liability as to the accuracy or completeness of any of the information and/or content provided herein and the Company cannot be held responsible for any omission, mistake nor for any loss or damage including without limitation to any loss of profit which may arise from reliance on any information supplied by TFA Global Pte Ltd.
The speaker(s) is neither an employee, agent nor representative of FXCM and is therefore acting independently. The opinions given are their own, constitute general market commentary, and do not constitute the opinion or advice of FXCM or any form of personal or investment advice. FXCM neither endorses nor guarantees offerings of third-party speakers, nor is FXCM responsible for the content, veracity or opinions of third-party speakers, presenters or participants.

AUD/JPY LOOK HEREThis is aud/jpy analysis as we can see market has already shift from downsside to the upside direction moving towards supply zone.at the moment i prefer to buy after a pillback end by targeting supply zone.at supply zone we can wait to see market reaction before start looking for short/long setup.

AUD/JPY: Bearish Reversal in Play, A Long Downtrend Awaits?Hey Realistic Traders, OANDA:AUDJPY has no chance for a Bullish Outlook? Let's dive into the analysis...
After a prolonged consolidation phase, the Aussie Yen has once again traded below the EMA-200 line, forming a new lower high along the way. This bearish signal marked the beginning of a continued downward movement, which was further confirmed by a breakout from a rising wedge pattern. Such breakouts typically indicate strong bearish momentum, especially when accompanied by multiple bearish marubozu candlesticks.
Further strengthening this outlook, a falling wedge breakout occurred on the JPYBASKET, signaling a continuation of its prevailing bullish trend. This divergence between Aussie Yen and JPYBASKET adds weight to our bearish analysis.
Considering these strong technical signals, the price is likely to move downward toward the first target at 94.651 or potentially the second target at 93.716.
However, this bearish scenario depends on the price staying below the critical stop-loss level at 98.478.
Support the channel by engaging with the content, using the rocket button, and sharing your opinions in the comments below.
"Disclaimer: "Please note that this analysis is solely for educational purposes and should not be considered a recommendation to take a long or short position on Aussie Yen".

Overlap resistance ahead?AUD/JPY is rising towards the pivot which is an overlap resistance and could drop to the 1st support which acts as a pullback support.
Pivot: 96.78
1st Support: 95.52
1st Resistance: 97.49
Risk Warning:
Trading Forex and CFDs carries a high level of risk to your capital and you should only trade with money you can afford to lose. Trading Forex and CFDs may not be suitable for all investors, so please ensure that you fully understand the risks involved and seek independent advice if necessary.
Disclaimer:
The above opinions given constitute general market commentary, and do not constitute the opinion or advice of IC Markets or any form of personal or investment advice.
Any opinions, news, research, analyses, prices, other information, or links to third-party sites contained on this website are provided on an "as-is" basis, are intended only to be informative, is not an advice nor a recommendation, nor research, or a record of our trading prices, or an offer of, or solicitation for a transaction in any financial instrument and thus should not be treated as such. The information provided does not involve any specific investment objectives, financial situation and needs of any specific person who may receive it. Please be aware, that past performance is not a reliable indicator of future performance and/or results. Past Performance or Forward-looking scenarios based upon the reasonable beliefs of the third-party provider are not a guarantee of future performance. Actual results may differ materially from those anticipated in forward-looking or past performance statements. IC Markets makes no representation or warranty and assumes no liability as to the accuracy or completeness of the information provided, nor any loss arising from any investment based on a recommendation, forecast or any information supplied by any third-party.

Going to be bulish for 1 yearAfter deep analyces of time cycle has now been completed
ITS GOING TO be BULISH FOR 1 YEAR, LONG TERM INVESTOR CAN BUY AND MAY GAIN UPTO 24%

AUD_JPY VERY RISKY SHORT|
✅AUD_JPY made a bearish
Breakout of the key horizontal
Level of 96.200 so we are
Locally bearish biased and
After the retest of the new
Resistance level we will be
Expecting a local move down
SHORT🔥
✅Like and subscribe to never miss a new idea!✅

AUDJPY"📉 AUDJPY Sell Trade: Still Running 🔄
Currently holding a sell position on AUDJPY. The pair has decreased by 1.46% in the past 24 hours, trading at approximately 95.359 JPY.
TRADINGVIEW.COM
The broader trend remains bearish, with technical indicators supporting the downward momentum. The 20-day and 50-day moving averages have formed a bearish crossover above the price action, reinforcing expectations of continued downside.
While the market shows promise, it's essential to stay vigilant and manage risk appropriately. The current price level is near the 95.00 support, and a break below this could open the path to lower targets.
#Forex #AUDJPY #TradingStrategy

AUD/JPY BULLS ARE GAINING STRENGTH|LONG
Hello, Friends!
We are going long on the AUD/JPY with the target of 98.524 level, because the pair is oversold and will soon hit the support line below. We deduced the oversold condition from the price being near to the lower BB band. However, we should use low risk here because the 1W TF is red and gives us a counter-signal.
✅LIKE AND COMMENT MY IDEAS✅

AUD/JPY "Aussie vs Japanese" Forex Market Heist Plan on Bullish🌟Hi! Hola! Ola! Bonjour! Hallo!🌟
Dear Money Makers & Robbers, 🤑 💰
Based on 🔥Thief Trading style technical and fundamental analysis🔥, here is our master plan to heist the AUD/JPY "Aussie vs Japanese" Forex market. Please adhere to the strategy I've outlined in the chart, which emphasizes long entry. Our aim is the high-risk Red Zone. Risky level, overbought market, consolidation, trend reversal, trap at the level where traders and bearish robbers are stronger. Be wealthy and safe trade.💪🏆🎉
Entry 📈 : Traders & Thieves with New Entry A bull trade can be initiated on the MA level breakout of 98.400
However I advise placing Buy limit orders within a 15 or 30 minute timeframe. Entry from the most recent or closest low or high level should be in retest.
Stop Loss 🛑: Using the 4H period, the recent / nearest low or high level.
Goal 🎯: 101.300 (or) Escape Before the Target
Scalpers, take note 👀 : only scalp on the Long side. If you have a lot of money, you can go straight away; if not, you can join swing traders and carry out the robbery plan. Use trailing SL to safeguard your money 💰.
Fundamental Outlook 📰🗞️
AUD/JPY is a popular currency pair that can be influenced by various fundamental and macroeconomic factors. Here's a brief analysis to help you make an informed decision:
Fundamental Analysis---
Interest Rate Differential: The Reserve Bank of Australia (RBA) has been keeping interest rates relatively high compared to the Bank of Japan (BOJ). This difference can make the AUD more attractive to investors, potentially driving up the value of AUD/JPY.
Commodity Prices: Australia is a major exporter of commodities like iron ore, coal, and gold. An increase in commodity prices can boost the Australian economy and support the AUD.
Economic Growth: Australia's economy has been showing signs of resilience, with a growing services sector and a rebound in consumer spending. Japan's economy, on the other hand, has been facing challenges, including a declining population and low inflation.
Macroeconomic Analysis---
Global Risk Sentiment: AUD/JPY is often considered a risk-on/risk-off pair. When investors are risk-averse, they tend to sell AUD and buy JPY, causing the pair to decline. Conversely, when risk appetite increases, AUD/JPY tends to rise.
Yield Curve: The yield curve in Australia has been relatively steep compared to Japan, which can attract investors seeking higher returns.
Central Bank Policies: The RBA has been maintaining a hawkish stance, while the BOJ has been keeping its ultra-loose monetary policy. This contrast can influence the AUD/JPY exchange rate.
Technical Analysis---
The AUD/JPY chart is showing a bullish trend, with the pair trading above its 200-day moving average. The Relative Strength Index (RSI) is around 60, indicating a moderate bullish momentum.
Conclusion---
Based on the fundamental and macroeconomic analysis, it seems that AUD/JPY might continue its bullish trend. However, it's essential to keep an eye on global risk sentiment, commodity prices, and central bank policies, as these factors can influence the pair's direction.
Trading Alert⚠️ : News Releases and Position Management 📰 🗞️ 🚫🚏
As a reminder, news releases can have a significant impact on market prices and volatility. To minimize potential losses and protect your running positions,
we recommend the following:
Avoid taking new trades during news releases
Use trailing stop-loss orders to protect your running positions and lock in profits
Please note that this is a general analysis and not personalized investment advice. It's essential to consider your own risk tolerance and market analysis before making any investment decisions.
Keep in mind that these factors can change rapidly, and it's essential to stay up-to-date with market developments and adjust your analysis accordingly.
💖Supporting our robbery plan will enable us to effortlessly make and steal money 💰💵 Tell your friends, Colleagues and family to follow, like, and share. Boost the strength of our robbery team. Every day in this market make money with ease by using the Thief Trading Style.🏆💪🤝❤️🎉🚀
I'll see you soon with another heist plan, so stay tuned 🫂

Risk-Off Sentiment and AUDJPY OutlookThe risk-off sentiment in the market could persist, as China's economic situation remains uncertain despite hitting its growth target. There have been multiple instances where China's reported data lacked transparency. However, with Trump's return and the implementation of tariffs starting February 1st, China’s economy could take a hit. Naturally, the Australian dollar, as a key supplier of raw materials to China, might come under pressure.
My trading strategy is based on the main trend, which is driven by macroeconomic analysis and news events. Sometimes my swing trades extend over the long term, while other times, they play out more quickly. Let’s see how this one unfolds!
Trend break out Breakout retest. After a resistance is broken we expect those that where being resisted to take over the market

AUD/JPY VS NZD/JPYWe had a support and big candle down then went up real aggressive making new structure. i am taking the trade that gets back to my zone last out of AUD/JPY and NZD/JPY

AUD/JPY At a Breaking Point – Big Move Loading!AUD/JPY is sitting at a crucial level right now. We're seeing a descending triangle pattern forming, with price getting squeezed between lower highs and key support around the 200 EMA (94.64).
A breakdown below this level could trigger a sharp drop, with targets around 90 and possibly 85-87 in the coming weeks. The bearish momentum is building, and today's red candle isn't looking too promising for bulls.
On the flip side, if buyers step in and push it back above 97.50, we might see a recovery towards the 100 level. But for now, the bias leans bearish unless we get a strong reversal signal.
Keep an eye on that 94 level – a breakdown could mean more downside ahead. 🔻

AUDJPY: 2 month range calls for a reboundAUDJPY is neutral on its 1D technical outlook (RSI = 45.920, MACD = -0.220, ADX = 20.692) as it is trading inside a Rectangle pattern. The price hit the pattern's bottom yesterday and today is rebounding towards the 4H MA50, already hitting the 0.382 Fibonacci retracement level. Such rebounds have always reached the 0.786 Fib at least, so with the 4H RSI also rebounding perfectly from the oversold area, we expect to test the 0.786 Fib again (TP = 98.385).
## If you like our free content follow our profile to get more daily ideas. ##
## Comments and likes are greatly appreciated. ##

AUDJPY: Long Trading Opportunity
AUDJPY
- Classic bullish formation
- Our team expects pullback
SUGGESTED TRADE:
Swing Trade
Long AUDJPY
Entry - 96.087
Sl - 95.573
Tp - 97.091
Our Risk - 1%
Start protection of your profits from lower levels
❤️ Please, support our work with like & comment! ❤️
