Potential bearish drop?AUD/JPY is rising towards the pivot and could drop to the 1st support.
Pivot: 96.78
1st Support: 95.71
1st Resistance: 97.49
Risk Warning:
Trading Forex and CFDs carries a high level of risk to your capital and you should only trade with money you can afford to lose. Trading Forex and CFDs may not be suitable for all investors, so please ensure that you fully understand the risks involved and seek independent advice if necessary.
Disclaimer:
The above opinions given constitute general market commentary, and do not constitute the opinion or advice of IC Markets or any form of personal or investment advice.
Any opinions, news, research, analyses, prices, other information, or links to third-party sites contained on this website are provided on an "as-is" basis, are intended only to be informative, is not an advice nor a recommendation, nor research, or a record of our trading prices, or an offer of, or solicitation for a transaction in any financial instrument and thus should not be treated as such. The information provided does not involve any specific investment objectives, financial situation and needs of any specific person who may receive it. Please be aware, that past performance is not a reliable indicator of future performance and/or results. Past Performance or Forward-looking scenarios based upon the reasonable beliefs of the third-party provider are not a guarantee of future performance. Actual results may differ materially from those anticipated in forward-looking or past performance statements. IC Markets makes no representation or warranty and assumes no liability as to the accuracy or completeness of the information provided, nor any loss arising from any investment based on a recommendation, forecast or any information supplied by any third-party.
ICmarkets
Following
Unfollow
IC Markets is an online forex broker specialized in providing transparent trading solutions to both retail and institutional investors alike. We provide superior execution technology, lower spreads and unrivaled liquidity.
Also on:
AUDJPY trade ideas


AUDJPY - Buy Opportunity at Key Support LevelOANDA:AUDJPY is approaching a significant support zone, where buyers have previously stepped in, leading to strong bullish reactions. The recent decline suggests a potential buying opportunity if the price shows signs of reversal.
A bullish confirmation, such as a strong rejection candle or a bounce from support, could indicate a move toward 97.240. However, a break below the support zone could invalidate this setup, signaling further downside.
This is not financial advice but rather how I approach support/resistance zones. Remember, always wait for confirmation, like a rejection candle or volume spike before jumping in.
Please boost this post, every like and comment drives me to bring you more ideas! I’d love to hear your perspective in the comments.
Best of luck , TrendDiva

audjpy buy signal. Don't forget about stop-loss.
Write in the comments all your questions and instruments analysis of which you want to see.
Friends, push the like button, write a comment, and share with your mates - that would be the best THANK YOU.
P.S. I personally will open entry if the price will show it according to my strategy.
Always make your analysis before a trade

Long buddy!!!I’m still long on this pair. While price has taken out liquidity in my premium area it is also hitting my last order block area. Divergence on my macd helps my confidence in the long trade I have taken
99.000 is my ultimate target area
Trade safely my friends

Long Buddy!!!Price has hit my premium to buy area. We had a break of structure on the 1hr time frame. Divergence on my macd strategy.
I have a long bias.
98.500-99.000 is my target are for the rest of this trading week
What are your thoughts?
Trade safely my friends

#001 Obvious Trend AUDJPY ShortRiding onto the Obvious Down Trend.
1R SL to 0.44R TP.
Coming back at 1am Singapore Time later.

Forex Fundamentals & JPY Strength Analysis | Daily Market UpdateForex Fundamentals & JPY Strength Analysis | Daily Market Update
In today’s video, we dive into the key fundamentals driving the forex market and analyze the strength of the Japanese Yen (JPY) for the day. Understanding the factors that affect currency movements, including economic data, geopolitical events, and central bank policies, is essential for making informed trading decisions.
We’ll also break down the current performance of the JPY, looking at recent trends, market sentiment, and what to watch out for throughout the day. Whether you’re a beginner or an experienced trader, this video will give you a clearer picture of how to navigate the forex market and assess the strength of major currencies like the Yen.
Key Topics Covered:
• Basic Forex Market Fundamentals
• Economic Indicators Influencing Currency Movements
• The Role of Central Banks & Interest Rates
• JPY Analysis: Current Strength & Market Outlook
• Tips for Day Trading with JPY Pairs

AUDJPY The Target Is UP! BUY!
My dear followers,
This is my opinion on the AUDJPY next move:
The asset is approaching an important pivot point 96.695
Bias - Bullish
Technical Indicators: Supper Trend generates a clear long signal while Pivot Point HL is currently determining the overall Bullish trend of the market.
Goal - 97.407
About Used Indicators:
For more efficient signals, super-trend is used in combination with other indicators like Pivot Points.
———————————
WISH YOU ALL LUCK

AUD/JPY Bearish Pennant Breakout and 500+ Pips TargetAUD/JPY represents the Australian Dollar against the Japanese Yen in the forex market. The current price is 96.800, with a target price of 86.000, indicating a strong bearish outlook. The expected price drop suggests a potential gain of 500+ pips if the trade moves as predicted. The analysis is based on the bearish pennant pattern, a continuation pattern signaling potential further downside. The price is currently consolidating within the pennant, awaiting a breakout. A bearish breakout would confirm strong selling pressure, leading to a sharp decline. Traders anticipate a drop toward the 86.000 level once the breakout occurs. This setup aligns with technical analysis, where pennants often lead to significant price movements. If the breakout is confirmed, momentum could accelerate the decline. Risk management is crucial, as false breakouts can occur.

AUD_JPY (55 Pips)The AUD/JPY currency pair has shown resilience by bouncing off the support level at 96.70 multiple times over the past week. This repeated defense of the 96.70 level suggests a strong foundation of buyer interest at this price point. The Relative Strength Index (RSI) on the daily chart has been indicating slightly oversold conditions, which has likely contributed to the short-covering activity around this level.
Given this pattern of support, the cross is now poised for a potential rebound of at least 55 pips. Technical indicators suggest that the next significant resistance could be around the 97.50 horizontal barrier. This level may act as a key pivotal point for short-term traders, potentially capping the upward movement of the AUD/JPY pair.
However, it's important to note that if the 96.70 support were to break convincingly, it could pave the way for deeper losses. In such a scenario, the next relevant support levels to watch would be near the 95.30 region, followed by the psychologically important 95.00 mark. Further downside could potentially extend to the 94.45-94.40 horizontal support and even the 94.00 level.
Traders should remain cautious and monitor incoming economic data and central bank communications from both Australia and Japan, as these factors could influence the pair's direction in the near term.

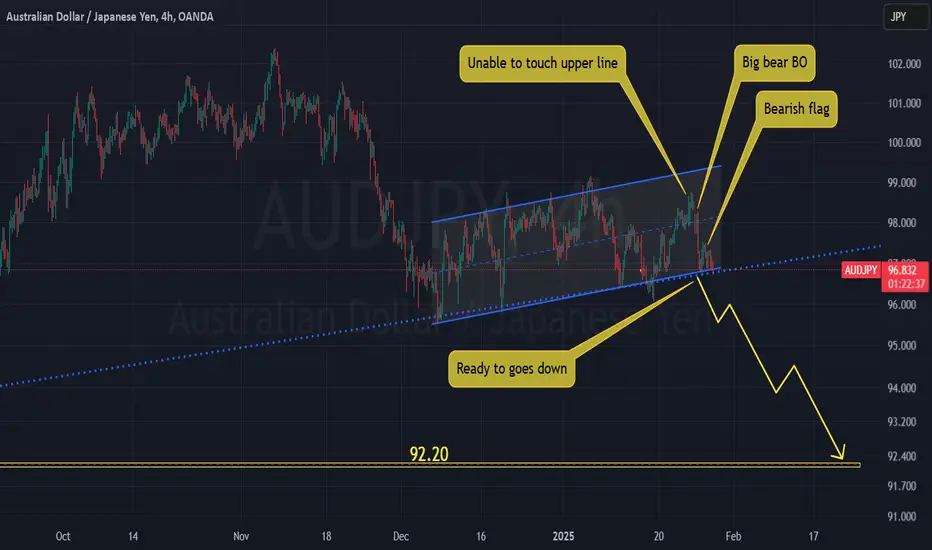
Aussie yen will weak again...After last week fake bear break out, Aussie is ready now to goes down.
Big bearish move after Aussie unable to touch upper line of the channel is good sign of bear control in Aussie yen pair.
trade safe
good luck.
BUY AUDJPYAUDJPY is at the demand zone and respecting the zone with with multiple wick rejection presenting the next bullish wave targeting the next liq....

AUDJPY - Short SetupMy main trading principle is that the price always moves from swept liquidity levels to untouched liquidity levels.
In particular case we clearly can see the following context: price swept 1D key liquidity level and left untouched level lower.
But to take more statistically probable trades we should wait for some type of lower timeframe confirmation, and in this case we can notice sign of weakness (reaching the middle of the range), so potentially there is a higher probability to see price lower.
Your success is determined solely by your ability to consistently follow the same principles.

AUDJPY Is Going Up! Buy!
Take a look at our analysis for AUDJPY.
Time Frame: 2h
Current Trend: Bullish
Sentiment: Oversold (based on 7-period RSI)
Forecast: Bullish
The market is trading around a solid horizontal structure 96.995.
The above observations make me that the market will inevitably achieve 97.514 level.
P.S
Please, note that an oversold/overbought condition can last for a long time, and therefore being oversold/overbought doesn't mean a price rally will come soon, or at all.
Like and subscribe and comment my ideas if you enjoy them!

Heading into 50% Fibonacci resistance?AUD/JPY is rising towards the resistance level which is an overlap resistance that aligns with the 50% Fibonacci retracement and could reverse from this level to our take profit.
Entry: 97.79
Why we like it:
There is an overlap resistance level that aligns with the 50% Fibonacci retracement.
Stop loss: 98.77
Why we like it:
There is a pullback resistance level.
Take profit: 96.63
Why we like it:
There is a pullback support level that aligns with the 78.6% Fibonacci retracement.
Enjoying your TradingView experience? Review us!
Please be advised that the information presented on TradingView is provided to Vantage (‘Vantage Global Limited’, ‘we’) by a third-party provider (‘Everest Fortune Group’). Please be reminded that you are solely responsible for the trading decisions on your account. There is a very high degree of risk involved in trading. Any information and/or content is intended entirely for research, educational and informational purposes only and does not constitute investment or consultation advice or investment strategy. The information is not tailored to the investment needs of any specific person and therefore does not involve a consideration of any of the investment objectives, financial situation or needs of any viewer that may receive it. Kindly also note that past performance is not a reliable indicator of future results. Actual results may differ materially from those anticipated in forward-looking or past performance statements. We assume no liability as to the accuracy or completeness of any of the information and/or content provided herein and the Company cannot be held responsible for any omission, mistake nor for any loss or damage including without limitation to any loss of profit which may arise from reliance on any information supplied by Everest Fortune Group.

AUDJPY: Will Keep Growing! Here is Why:
Balance of buyers and sellers on the AUDJPY pair, that is best felt when all the timeframes are analyzed properly is shifting in favor of the buyers, therefore is it only natural that we go long on the pair.
❤️ Please, support our work with like & comment! ❤️

BUY AUDJPYIn todays session we are monitoring a buy set up on AUDJPY. Our entry at 97.138 and targets at 98.337. Our stops below 96.600. Use proper risk management and best of luck.

AUD/JPY Sellers Target Key Support Amid Diverging Monetary OutloThe AUD/JPY pair remains under bearish pressure, with sellers eyeing a sustained break below critical support at 97.700. While technical indicators confirm the dominance of downward momentum, upcoming economic events in both Japan and Australia could introduce volatility, potentially influencing the pair's trajectory.
Key Technical Levels
• Resistance Levels: 97.907, 98.243
• Support Levels: 97.700, 97.552, 97.364, 97.157
Read full article here:
erranteacademy.com

AUD/JPY BUYERS WILL DOMINATE THE MARKET|LONG
Hello, Friends!
AUD/JPY is trending up which is evident from the green colour of the previous weekly candle. However, the price has locally plunged into the oversold territory. Which can be told from its proximity to the BB lower band. Which presents a beautiful trend following opportunity for a long trade from the support line below towards the supply level of 98.447.
✅LIKE AND COMMENT MY IDEAS✅

Key Resistance Level for AUDJPY: Towards 98.000?OANDA:AUDJPY is approaching a critical resistance level that has previously seen bearish reversals. The ongoing bullish momentum could provide an opportunity for sellers to step in and take control.
Key point: If we observe bearish signals such as rejection wicks at this resistance, the price could potentially drop towards 98.000. However, a breakout above this level would invalidate the bearish setup and shift the bias to a more bullish outlook.
It’s important to wait for clear rejection signals before considering any short positions. I'd love to hear your thoughts or different perspectives in the comments!

AUDJPY: Gap Should Be Filled 🇦🇺🇯🇵
AUDJPY is going to fill a gap down opening
after a test of a key horizontal support.
As a confirmation, I see a formation of a bullish imbalance
candle on an hourly time frame.
Goal - 98.45
❤️Please, support my work with like, thank you!❤️

AUDJPY buy signal. Don't forget about stop-loss.
Write in the comments all your questions and instruments analysis of which you want to see.
Friends, push the like button, write a comment, and share with your mates - that would be the best THANK YOU.
P.S. I personally will open entry if the price will show it according to my strategy.
Always make your analysis before a trade
