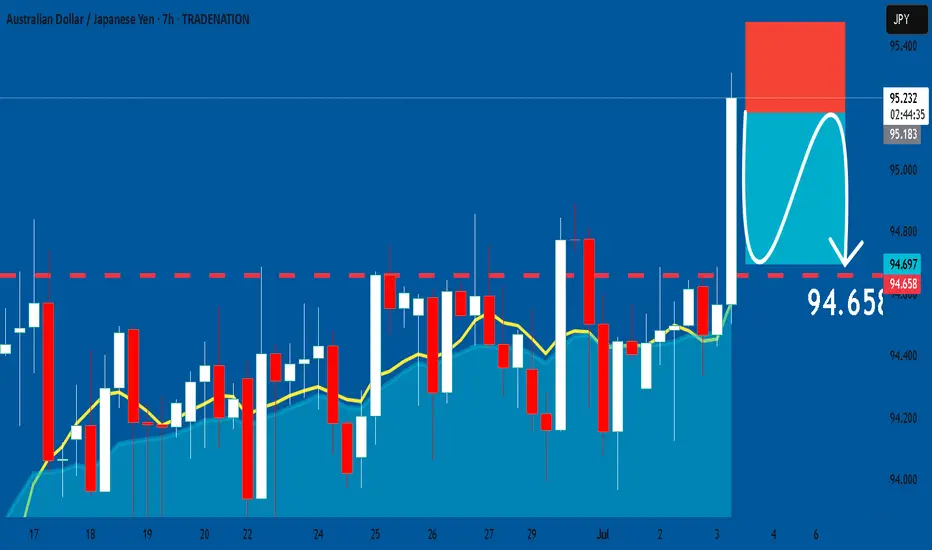
AUDJPY: Short Trade Explained
AUDJPY
- Classic bearish formation
- Our team expects fall
SUGGESTED TRADE:
Swing Trade
Sell AUDJPY
Entry Level - 95.193
Sl - 95.477
Tp - 94.658
Our Risk - 1%
Start protection of your profits from lower levels
Disclosure: I am part of Trade Nation's Influencer program and receive a monthly fee for using their TradingView charts in my analysis.
❤️ Please, support our work with like & comment! ❤️
AUDJPY trade ideas
AUD/JPY# AUD/JPY: Two High-Probability Bearish Setups 🎯
## Overview
AUD/JPY continues to respect its macro downtrend structure, offering two compelling bearish opportunities as price approaches critical resistance levels. Currently trading at 94.398, the pair sits at an inflection point between key support and resistance zones.
---
## 📊 Setup 1: Resistance Zone Rejection (Primary)
### Key Level: 95.289 (Major Resistance)
This level has proven its significance multiple times:
- ✅ Strong resistance throughout recent months
- ✅ Clear seller dominance at this zone
- ✅ Confluence with descending channel structure
### Entry Strategy:
1. **Wait** for price to approach 95.289
2. **Identify** bearish rejection patterns:
- Pin bars / Shooting stars
- Bearish engulfing candles
- Multiple wick rejections
3. **Enter** short on confirmed rejection
4. **Stop Loss**: 95.50-95.60 (above resistance)
5. **Targets**:
- TP1: 93.240 (1:2 RR)
- TP2: 92.271 (1:3.5 RR)
---
## 📊 Setup 2: Rising Wedge Breakdown (Secondary)
### Pattern Recognition:
A textbook rising wedge has formed since the May lows - a bearish reversal pattern within the larger downtrend context.
### Entry Strategy:
1. **Monitor** the lower wedge trendline
2. **Wait** for decisive breakdown with volume
3. **Enter** short on retest of broken support
4. **Stop Loss**: Above recent swing high
5. **Target**: 93.240 support zone
---
## 📈 Market Structure Analysis
### Macro Trend: BEARISH 📉
- Consistent lower highs and lower lows from 102+ levels
- Currently in corrective bounce phase
- Respecting descending channel boundaries
### Current Position:
Price trapped between:
- **Resistance**: 95.289
- **Support**: 93.240
- **Deep Support**: 92.271
---
## ⚠️ Risk Management
**Patience is key!** Current price offers poor risk/reward. Wait for:
1. **Scenario A**: Test of 95.289 resistance → Short opportunity
2. **Scenario B**: Break below wedge support → Short opportunity
3. **Scenario C**: Break above 95.289 → Invalidation, stay flat
### Position Sizing:
- Risk per trade: 1-2% of account
- Adjust position size based on stop distance
---
## 🎯 Trade Summary
**Bias**: BEARISH 🐻
**Preferred Setup**: Resistance rejection at 95.289
**Risk/Reward**: Minimum 1:2
**Timeframe**: Daily
---
*Remember: The best trades come to those who wait. Let price come to your levels, don't chase!*
**What's your view? Drop a comment below! 👇**
*Disclaimer: This is not financial advice. Always do your own research and manage risk appropriately.*
---

AUD/JPY SENDS CLEAR BEARISH SIGNALS|SHORT
Hello, Friends!
We are now examining the AUD/JPY pair and we can see that the pair is going up locally while also being in a uptrend on the 1W TF. But there is also a powerful signal from the BB upper band being nearby, indicating that the pair is overbought so we can go short from the resistance line above and a target at 93.578 level.
Disclosure: I am part of Trade Nation's Influencer program and receive a monthly fee for using their TradingView charts in my analysis.
✅LIKE AND COMMENT MY IDEAS✅

AUDJPY - let's do it again!Hello TradingView Family / Fellow Traders. This is Richard, also known as theSignalyst.
As per our last AUDJPY analysis (attached on the chart), it rejected the first blue circle zone and surged in a parabolic manner.
📈AUDJPY is currently retesting the intersection of the blue trendline and red support.
📚 As per my trading style:
As #AUDJPY is around the latest blue circle zone, I will be looking for bullish reversal setups (like a double bottom pattern, trendline break , and so on...)
📚 Always follow your trading plan regarding entry, risk management, and trade management.
Good luck!
All Strategies Are Good; If Managed Properly!
~Rich
Disclosure: I am part of Trade Nation's Influencer program and receive a monthly fee for using their TradingView charts in my analysis.

AUD/JPY pair exhibits a strong buy signalThe AUD/JPY cross attracts some buyers around 94.50 during the Asian session on Wednesday. The Japanese Yen edges lower against the Aussie following domestic weaker than expected inflation data for May as the relative interest rate differentials between the two currencies will play a crucial role in determining the AUD/JPY direction.
From a technical perspective, the AUD/JPY appears poised to test higher prices in the short term. The Relative Strength Index (RSI) is bullish, while price action posting a series of higher lows, despite lacking higher highs, could pave the way for challenging the 95.00 figure. A breach of the latter will expose the April 2 high of 95.30, followed by the May 13 swing high of 95.64.
Conversely, a reversal that drives AUD/JPY below the June 30 swing low of 93.98 could sponsor a drop to challenge a seventh month-old support trendline near 93.50/75. If cleared, down lies 93.00.
The forecasts provided herein are intended for informational purposes only and should not be construed as guarantees of future performance. This is an example only to enhance a consumer's understanding of the strategy being described above and is not to be taken as Blueberry Markets providing personal advice.

AUDJPY: Bullish Move From Support 🇦🇺🇯🇵
There is a high chance that AUDJPY will bounce
from the underlined horizontal support.
The price formed a bullish imbalance candle after its test.
I expect a rise to 94.49 level.
❤️Please, support my work with like, thank you!❤️
I am part of Trade Nation's Influencer program and receive a monthly fee for using their TradingView charts in my analysis.

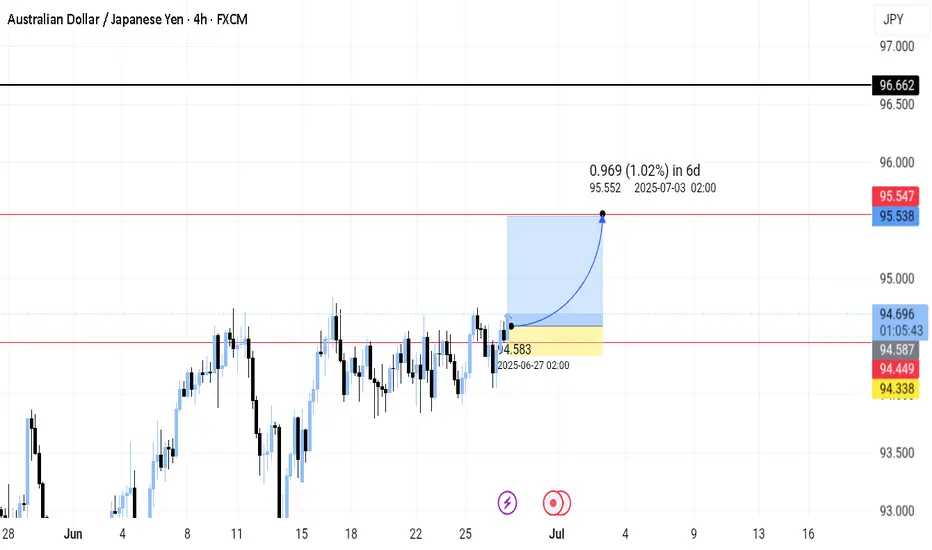
AUDJPY Trading Opportunity! BUY!
My dear subscribers,
My technical analysis for AUDJPY is below:
The price is coiling around a solid key level - 94.200
Bias - Bullish
Technical Indicators: Pivot Points Low anticipates a potential price reversal.
Super trend shows a clear buy, giving a perfect indicators' convergence.
Goal - 94.441
About Used Indicators:
By the very nature of the supertrend indicator, it offers firm support and resistance levels for traders to enter and exit trades. Additionally, it also provides signals for setting stop losses
Disclosure: I am part of Trade Nation's Influencer program and receive a monthly fee for using their TradingView charts in my analysis.
———————————
WISH YOU ALL LUCK
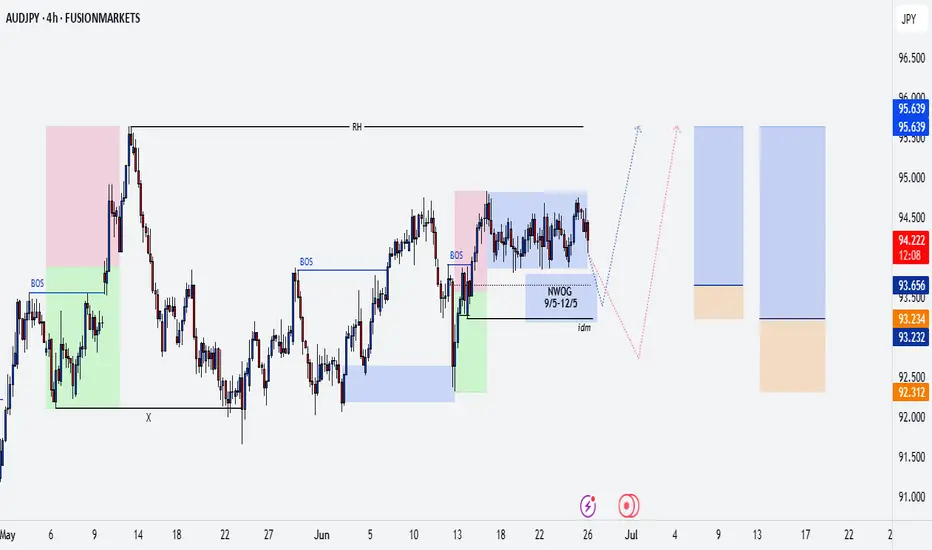
AUDJPY SHORT FORECAST Q3 W27 D1 Y25AUDJPY SHORT FORECAST Q3 W27 D1 Y25
Professional Risk Managers👋
Welcome back to another FRGNT chart update📈
Diving into some Forex setups using predominantly higher time frame order blocks alongside confirmation breaks of structure.
Let’s see what price action is telling us today! 👀
💡Here are some trade confluences📝
✅Weekly Order Block Identified
✅Daily Order block identified
✅4H Order Block identified
✅15' Order block identified
🔑 Remember, to participate in trading comes always with a degree of risk, therefore as professional risk managers it remains vital that we stick to our risk management plan as well as our trading strategies.
📈The rest, we leave to the balance of probabilities.
💡Fail to plan. Plan to fail.
🏆It has always been that simple.
❤️Good luck with your trading journey, I shall see you at the very top.
🎯Trade consistent, FRGNT X

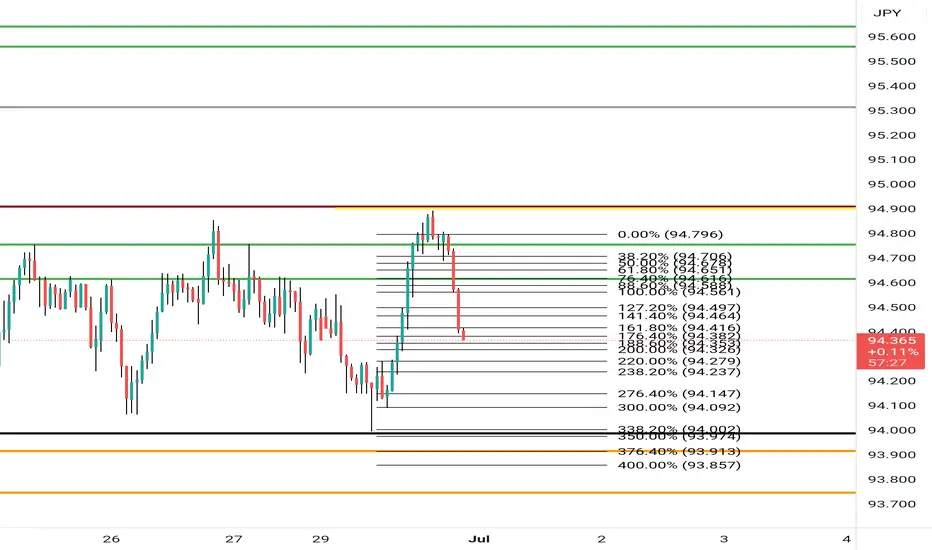
ShortWait for pullback to level of support Which was broken at the 76 fib level the green lines on top And take profits at 376 fib level orange line on the bottom which is the next level of support
How 🤔 ever if price breaks thru the the green line of resistance wait for pullback to the same green line and buy back up to the next level of resistance
AUDJPY - Bullish flagWe have a bullish flag that has developed. I will be expecting to see a breakout long here soon. Trade & fag are based of the M5 timeframe.

Potential Buy Opportunity on AUDJPYReasons I think this pair will rise:
- RSI oversold on Daily
- Confirmed Trend line printed higher low
What do you think?

AUDJPY – Trade the Range… Until It EndsHello TradingView Family / Fellow Traders. This is Richard, also known as theSignalyst.
📈AUDJPY has been trading within a big range marked in red.
Moreover, the it is retesting the lower bound of its rising channel marked in blue.
🏹 Thus, the highlighted blue circle is a strong area to look for buy setups as it is the intersection of support and lower blue trendline acting as a non-horizontal support.
📚 As per my trading style:
As #AUDJPY approaches the blue circle zone, I will be looking for bullish reversal setups (like a double bottom pattern, trendline break , and so on...)
📚 Always follow your trading plan regarding entry, risk management, and trade management.
Good luck!
All Strategies Are Good; If Managed Properly!
~Rich
Disclosure: I am part of Trade Nation's Influencer program and receive a monthly fee for using their TradingView charts in my analysis.

Long Setup – AUDJPY (W Pattern Completion & Shift Confirmation)
Price swept key sellside liquidity at 94.227 and held support just above 94.147. A clean W pattern has now formed with a decisive bullish body close above the shift zone, confirming bullish intent. Entered long with a take profit set at the box equilibrium level of 94.497 and stop loss placed below structure at 94.121. Trade aligns with structure, liquidity engineering, and price reaction from deep discount of the box

AUDJPY – Buy the Dip Ahead of Tankan DataTrade Idea
Type: Buy Limit
Entry: 94.00
Target: 95.00
Stop Loss: 93.50
Duration : Intraday
Expires: 01/07/2025 06:00
Technical Overview
The broader trend in AUDJPY remains bullish, with no clear signs of a top at this stage.
A correction is possible, providing an opportunity to buy into strength without disrupting the higher trend structure.
Short-term RSI has turned positive, suggesting momentum is starting to recover.
A move above 94.50 will act as further confirmation of bullish continuation, supporting the push toward the measured move target of 95.25.
Key Technical Levels
Support: 94.25 / 94.00 / 93.75
Resistance: 94.50 / 94.75 / 95.00
Disclosure: I am part of Trade Nation's Influencer program and receive a monthly fee for using their TradingView charts in my analysis.

AUDJPY 4hour TF - June 29th, 2025AUDJPY 4hour Neutral Idea
Monthly - Bullish
Weekly - Bearish
Dailly - Bearish
4hour - Ranging
AJ is currently sitting at a major daily resistance area around 94.500. We have to wait for price action to make a move and show some conviction before we can become confident in a setup.
Lucky us, price action is usually easy to follow when waiting for a break of a range. The way I see it, we have two great options.
Bullish Breakout - In the scenario where we see price action break above the 94.500 zone we will look for long setups. Ideally, we spot some clear higher lows above 94.500 with strong bullish conviction. Look to target higher resistance levels like 96.500.
Bearish Continuation - If we see this resistance level at 94.500 continue to hold we could see a daily bearish continuation happen. Look for strong bearish candles rejecting the current zone followed by clear lower highs. We’re targeting lower if that happens to around the 92.000 area.

AUDJPY WEEKLY HIGHER TIME FRAME FORECAST Q3 W27 Y25AUDJPY WEEKLY HIGHER TIME FRAME FORECAST Q3 W27 Y25
Professional Risk Managers👋
Welcome back to another FRGNT chart update📈
Diving into some Forex setups using predominantly higher time frame order blocks alongside confirmation breaks of structure.
Let’s see what price action is telling us today! 👀
💡Here are some trade confluences📝
✅Weekly 50EMA Rejection
✅Daily Order block identified
✅1H Order Block identified
🔑 Remember, to participate in trading comes always with a degree of risk, therefore as professional risk managers it remains vital that we stick to our risk management plan as well as our trading strategies.
📈The rest, we leave to the balance of probabilities.
💡Fail to plan. Plan to fail.
🏆It has always been that simple.
❤️Good luck with your trading journey, I shall see you at the very top.
🎯Trade consistent, FRGNT X

Back tested My Support and Resistance Strategy as a Beginner – AI’ve been back testing my support and resistance strategy on the AUD/JPY currency pair as a beginner, and I’m starting to see some encouraging results. By focusing on key levels where price reacts, I’ve noticed that my win rate is currently higher than my losses.
This simple approach is helping me understand price action better and build confidence in my strategy. I’m still learning and making adjustments, but it’s motivating to see progress and consistency starting to form.
Open to any feedback or tips from more experienced traders!

AUDJPY – Extended M Reversal in Box Premium (27/06/25)
Price swept buyside liquidity at 94.753, forming the second leg of an extended M pattern within the premium zone of the defined box. A clean bearish shift followed, confirmed with a strong-bodied close and short upper wick. Entry was executed post-shift, with confluence from Bright Gold liquidity clusters identified in discount using the HeatMap.
TP set at the box low (94.383), aligning with a major sellside liquidity draw. Stop Loss placed just above the box high, maintaining structure integrity.
Thesis:
- Buyside liquidity sweep + extended M in premium
- Structure shift + bearish intent confirmed
- HeatMap + box theory aligned with short narrative
- Letting price seek liquidity beneath equilibrium
DISCLAIMER: NOT RECOMMENDED TO TRADE SHORT WHEN YOU SEE THIS. MOST OF MOVE IS ALREADY DONE. THIS IS JUST TO PREVIEW AND LEARN THAT TAKING TRADES LIKE THIS CAN BE POSSIBLE

AUDJPY SHORT FORECAST Q2 W26 D27 Y25AUDJPY SHORT FORECAST Q2 W26 D27 Y25
Professional Risk Managers👋
Welcome back to another FRGNT chart update📈
Diving into some Forex setups using predominantly higher time frame order blocks alongside confirmation breaks of structure.
Let’s see what price action is telling us today! 👀
💡Here are some trade confluences📝
✅Weekly Order Block Identified
✅Daily Order block identified
✅4H Order Block identified
✅15' Order block identified
🔑 Remember, to participate in trading comes always with a degree of risk, therefore as professional risk managers it remains vital that we stick to our risk management plan as well as our trading strategies.
📈The rest, we leave to the balance of probabilities.
💡Fail to plan. Plan to fail.
🏆It has always been that simple.
❤️Good luck with your trading journey, I shall see you at the very top.
🎯Trade consistent, FRGNT X

AUDJPYBreak of structure confirmed. Support turned Resistance and continuation of trend. Long on this!
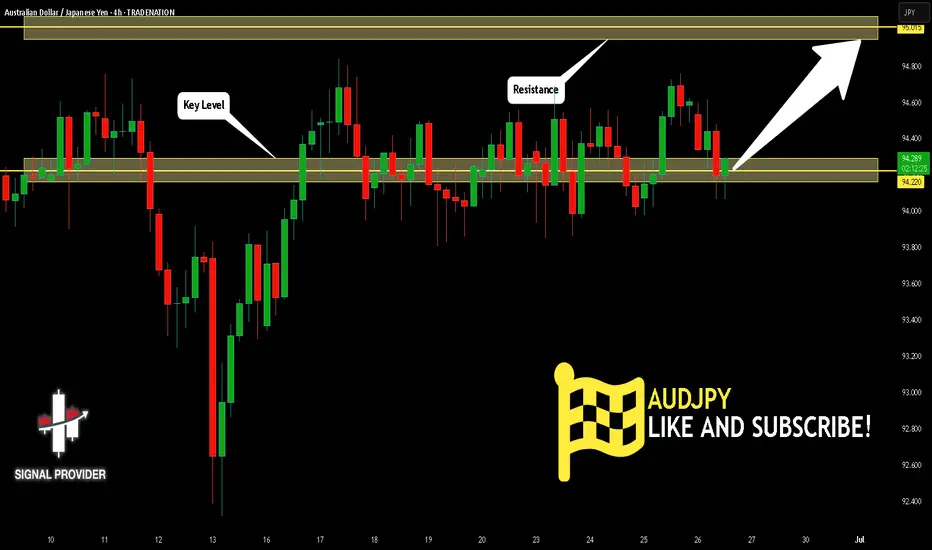
AUDJPY Is Bullish! Long!
Here is our detailed technical review for AUDJPY.
Time Frame: 4h
Current Trend: Bullish
Sentiment: Oversold (based on 7-period RSI)
Forecast: Bullish
The market is trading around a solid horizontal structure 94.220.
The above observations make me that the market will inevitably achieve 95.015 level.
P.S
Please, note that an oversold/overbought condition can last for a long time, and therefore being oversold/overbought doesn't mean a price rally will come soon, or at all.
Disclosure: I am part of Trade Nation's Influencer program and receive a monthly fee for using their TradingView charts in my analysis.
Like and subscribe and comment my ideas if you enjoy them!
AUDJPY – Buy the Dip Ahead of Tokyo CPITrade Idea
Type: Buy Limit
Entry: 94.00
Target: 95.00
Stop Loss: 93.50
Duration: Intraday
Expires: 27/06/2025 06:00
Technical Overview
The broader trend in AUDJPY remains bullish, with no technical evidence of a top forming.
A short-term correction is likely, creating an opportunity to buy into support near 94.00, where a Buy Limit is set.
Short-term RSI has turned positive, and a break above 94.50 will likely confirm renewed bullish momentum.
The measured move target sits at 95.25, though the trade targets a more conservative 95.00 resistance zone for intraday execution.
Key Technical Levels
Support: 94.25 / 94.00 / 93.75
Resistance: 94.50 / 94.75 / 95.00
Disclosure: I am part of Trade Nation's Influencer program and receive a monthly fee for using their TradingView charts in my analysis.

#AJ Long Idea#AJ has been consolidating in 4H bullish structure for more than a month now. also that it is accumulating in 4h (a n algo signature of AMD/PO3) expect a massive outbreak to EQH.