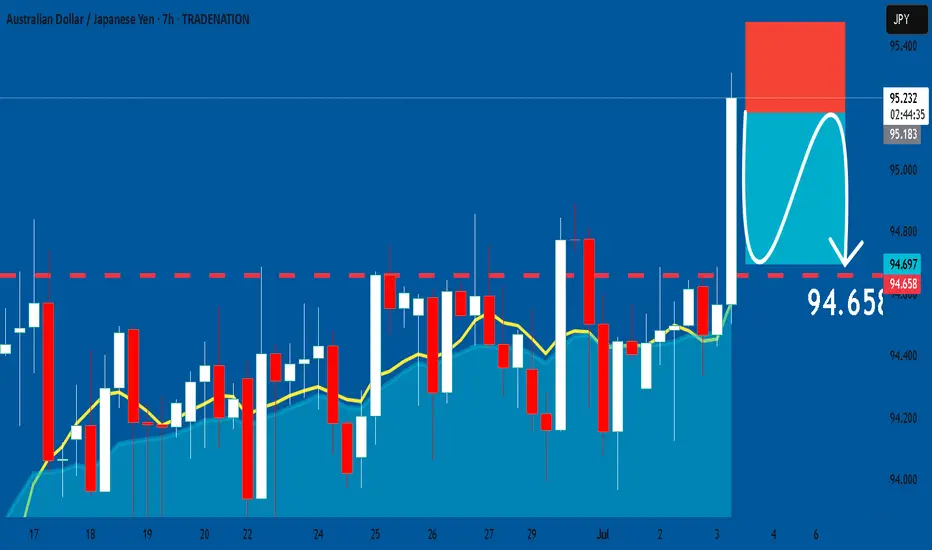
AUD-JPY Bullish Breakout! Buy!
Hello,Traders!
AUD-JPY is trading in a
Strong uptrend and the pair
Made a bullish breakout of
The key horizontal level
Of 95.650 which is now a
Support and the breakout
Is confirmed so we are bullish
Biased and we will be expecting
A further bullish move up
Buy!
Comment and subscribe to help us grow!
Check out other forecasts below too!
Disclosure: I am part of Trade Nation's Influencer program and receive a monthly fee for using their TradingView charts in my analysis.
AUDJPY trade ideas

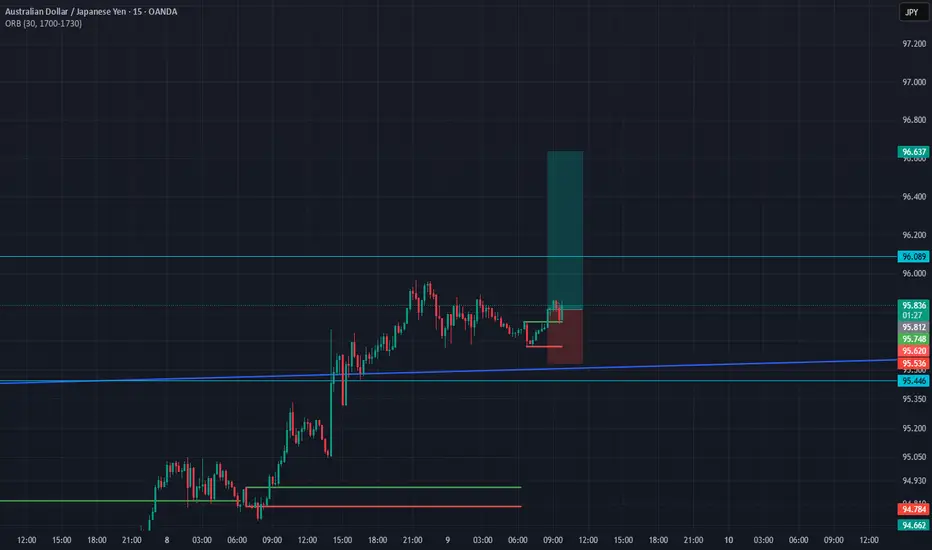
AUD/JPY ORB LONGFollowing yesterdays news, once again in confluence with upper ORB breakout and close of 15min candle
1:3 RR
DONT RISK YOUR RENT ON ONE TRADE, IT AINT WORTH IT
AUDJPY SHORT FORECAST Q3 D8 W28 Y25AUDJPY SHORT FORECAST Q3 D8 W28 Y25
Professional Risk Managers👋
Welcome back to another FRGNT chart update📈
Diving into some Forex setups using predominantly higher time frame order blocks alongside confirmation breaks of structure.
Let’s see what price action is telling us today! 👀
🔑 Remember, to participate in trading comes always with a degree of risk, therefore as professional risk managers it remains vital that we stick to our risk management plan as well as our trading strategies.
📈The rest, we leave to the balance of probabilities.
💡Fail to plan. Plan to fail.
🏆It has always been that simple.
❤️Good luck with your trading journey, I shall see you at the very top.
🎯Trade consistent, FRGNT X

AUDJPY SHORT FORECAST Q3 W28 Y25AUDJPY SHORT FORECAST Q3 W28 Y25
Professional Risk Managers👋
Welcome back to another FRGNT chart update📈
Diving into some Forex setups using predominantly higher time frame order blocks alongside confirmation breaks of structure.
Let’s see what price action is telling us today! 👀
💡Here are some trade confluences📝
✅Weekly Order Block Identified
✅Daily Order block identified
✅4H Order Block identified
✅15' Order block identified
🔑 Remember, to participate in trading comes always with a degree of risk, therefore as professional risk managers it remains vital that we stick to our risk management plan as well as our trading strategies.
📈The rest, we leave to the balance of probabilities.
💡Fail to plan. Plan to fail.
🏆It has always been that simple.
❤️Good luck with your trading journey, I shall see you at the very top.
🎯Trade consistent, FRGNT X

RBA in focus: AUD JPY to continue up? It's a week bereft of major US data. In the main it'll be up to the 'risk environment' to determine proceedings (which currently means tariff headlines).
But we do have the RBA and RBNZ rate decisions to potentially create opportunities.
First up, during Tuesday's Asian session is the RBA, a central bank with a preference for high interest rates (hawkish).
*Reminder: (risk environment aside) high interest rates 'generally' equals strong currency.
Analyst concencious is for a 0.25bp cut.
I can envision two scenarios:
A rate cut with 'hawkish narrative' (non or limited cuts on the horizon).
No rate cut (hold), with data dependent forward guidance.
Both scenarios 'should' be AUD positive. Possibly creating another AUD JPY long trade.
Of course, especially after Friday's NFP, we know that anything can happen and the RBA could deliver a 'dovish cut'. But considering inflation is still relatively high in Australia, I would be surprised with that outcome.
And, of course, a lot depends on the overall 'risk environment'. We could very well have 200% tariffs across the board in 12 hours time. And I would only long the AUD in a 'positive risk environment'.
*Side note: With the S&P 'near all time highs', it's only natural that it could pull back a little. So, I'm more focused on the actual narrative at the moment rather than correlations.
**Second side note: I'm slowly starting to revisit the ' buy / sell stop anticipation trade'. And arguably, an 'AUD long' pre-rate decision is viable. (Whereby you place an 'AUD long' stop order pre event, if it's a dovish outcome the order doesn't trigger). It's not something I endorse in a 'live account' but it's a strategy worth considering. Particularly as I suspect 'red flag' US releases could become important moving forward.
Ultimately, no matter the type of trade you take, it's very important to remember that 50% will hit profit and 50% will stop out. That's why we use a higher risk/ reward per trade.

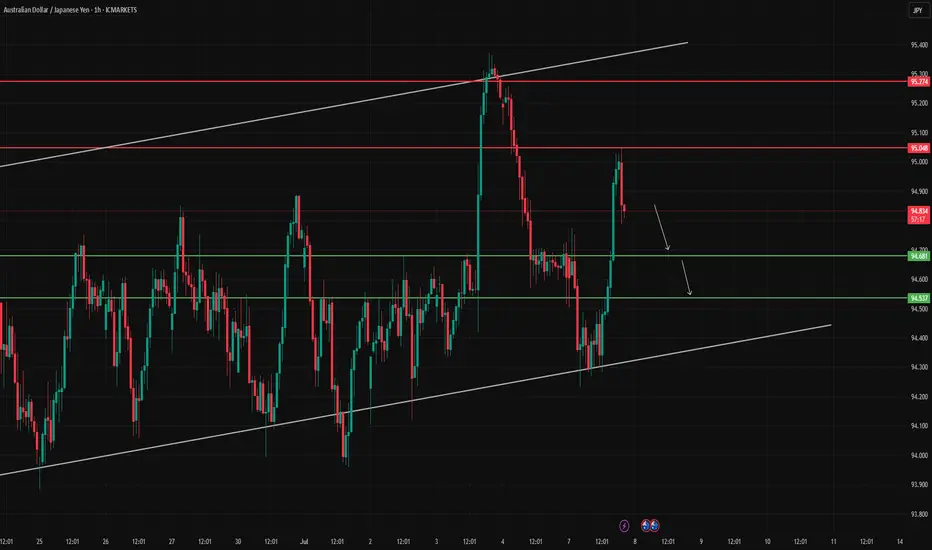
AUDJPY Rejected Key Resistance – Eyes on Downside TargetsThe AUDJPY pair faced rejection from the 95.048 resistance zone, showing potential for a bearish move. If this level continues to hold, price may slide toward the next key support levels at 94.681 and 94.537.
⚠️ Invalidation: A break and hold above 95.274 may cancel the bearish scenario.
This idea is for educational purposes only.
AUDJPY LONG????OANDA:AUDJPY showing resilience at channel support (94.50).
Multi-year uptrend intact with price bouncing from lower boundary. Current consolidation above 94 suggests strength.
Watch for continuation toward 100 resistance. #forex #technicalanalysis

Live trade: AUD JPY long 84.72
20 pip stop loss, 25 pip profit target
The AUD started the week under pressure as the US president singled out the BRICS nations tariffs. (The AUD falling in sympathy with china).
It has since been telegraphed that in general, tariff negotiations are going well, the market is expecting good news. And any 'risk off' moves are reversing.
Arguably, any currency could be traded Vs the JPY as a 'risk on' trade. I've chosen the AUD as it currently has short term momentum Vs the other currencies.
It's a 20 pip stop loss with 25 pip profit target 1.2: 1 risk reward.
The risk to the trade is negative sentiment (probably caused by negative tariff news). Or the fact there isn't a swing to speak of the hide the stop loss behind.
If the trade is still ongoing, I will closed the it before the RBA interest rate meeting to avoid holding risk during the event.

AUDJPY bullish continuation for expect
OANDA:AUDJPY we are have strong bullish push from 22.April, price is start reversing from 14.5., currently how looks price is find ground on strong zone 92.100, based on PA what can see we will have strong bullish push here.
SUP zone: 92.550
RES zone: 95.500, 96.300

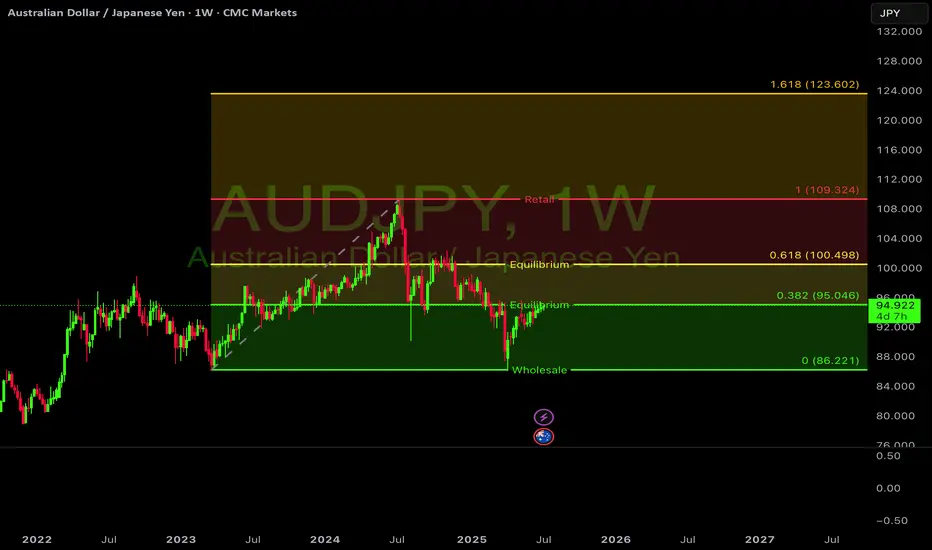
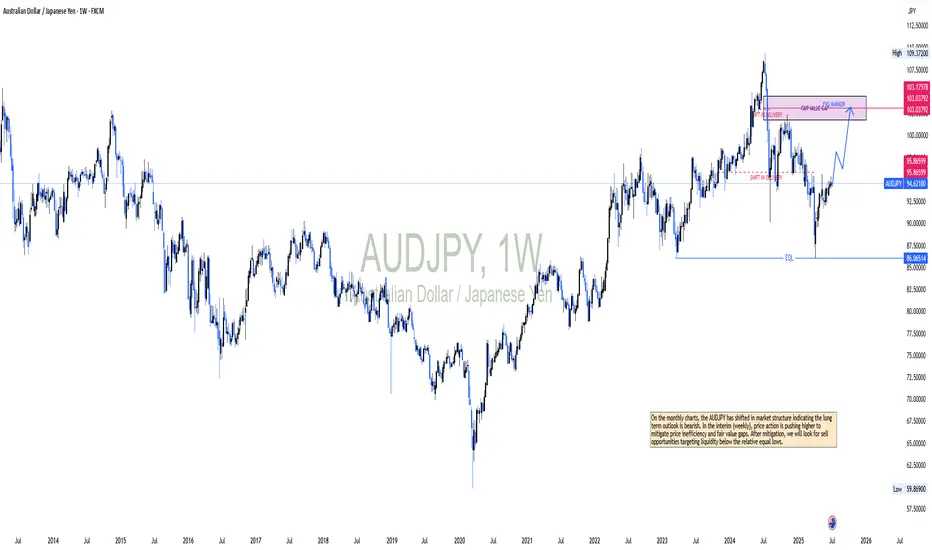
AUDJPY OUTLOOKOn the monthly charts, the AUDJPY has shifted in market structure indicating the long term outlook is bearish. In the interim (weekly), price action is pushing higher to mitigate price inefficiency and fair value gaps. After mitigation, we will look for sell opportunities targeting liquidity below the relative equal lows.
AUD/JPY LONGAUD/JPY LONG "break of a resistance area and retest + 61.8% fib retracement + 50 ema dynamic support "

The Chart Says ''Cheer Up Japan'' – JPY Looks Safe📊🇯🇵 The Chart Says "Cheer Up Japan" – JPY Looks Safe 💙✨
There’s been talk, worry, even viral prophecy this week… but I’m here to say:
I read charts — not fear.
And right now, the JPY is showing strength, not weakness.
After running a full scan with my AI-powered Precision Master Mode, the cleanest trade setup aligned with this view is:
AUDJPY SHORT 📉
🗾 Cheer up, Japan — the Yen’s got this.
No panic in the charts. Just structure, volume, and momentum confirming that JPY is holding its ground as a safe-haven currency.
🔍 TRADE SETUP – AUDJPY SHORT
ENTRY: Market (or 94.85 for better R:R)
STOP LOSS: 95.70 (above trap high)
TARGETS:
TP1: 93.50
TP2: 91.57
TP3: 87.84 (macro target)
📈 What the chart shows:
– Strong rejection from top channel zone (structure is King!)
– SuperTrend flip starting on multiple TFs
– VWRSI fading = momentum loss
– Volume Profile confirms resistance
So while the headlines play on emotions, my execution comes from structure.
Let’s ride this JPY strength into next week — calmly, confidently.
📸 Chart attached (8H view – AI tuned)
📰 Article on the 'prophecy' that sparked the buzz:
www.telegraphindia.com
Have a nice weekend Japan and all Asia! After a 'scary prophecy' troubling your minds the weekend can end up being a crazy happy one!
One Love,
The FXPROFESSOR 💙
Disclosure: I am happy to be part of the Trade Nation's Influencer program and receive a monthly fee for using their TradingView charts in my analysis. Awesome broker, where the trader really comes first! 🌟🤝📈

AUDJPY SELLBy utilizing levels, historical patterns, , we can formulate a hypothesis that the market might follow a similar trajectory if bearish sentiment prevails.

Weekly Review: Risk remains positive, but tariffs in focus. The week starting Monday 30 June began with the USD on the back foot in a continuation of the previous week's narrative. With the market anticipating at least two cuts from the FED before year end.
Alongside USD weakness, the overall market mood remained positive, the S&P hovers near all time highs and the VIX remains well below 20 as Middle East concerns ebbed and tariff concerns are put to one side (how long for?).
The 'risk on / weak dollar' narrative remained throughout the week, at least until Fridays 'upside surprise' NFP data. Which is a reminder to expect the unexpected, many analysts predicted a below forecast number, especially given Wednesday's 'soft' ADP data. But a much stronger than forecast headline number gave the USD a boost. And hit the JPY particularly hard as we got an old fashioned stocks up / yields up = risk on day.
I'm doubtful NFP will be a game changer for the USD though. And I begin the new week with my 'risk on' bias intact, comparing the USD and JPY against each other to determine which currency is the best short option. Not ruling out the CHF as a potential short, but the Swiss franc is still having bouts of strength at odds with the overall positive tone.
The potential spanner in the works this coming week will be the tariff narrative. The 90 day reprieve ends on July 9 and we could get some fireworks.
It seems the market is 'hoping' for a blanket 10% across the board. I suspect the best we can hope for this week is a 'kicking of the can down the road'. The worst case scenario would be a resumption of the chaos we saw in April.
In other news, the GBP came under pressure as the government's fiscal policies are scurtinised. I suspect that the UK's relatively high interest rate and the overall 'risk on' market mood, stopped the pound from depreciating further. But it could be a bumpy road ahead for the GBP.
On a personal note. It was a week of 'only' one trade. But that was due to my busy schedule rather than a lack of opportunities. I missed Monday's USD weakness, the potential GBP short catalyst and Thursdays post NFP 'risk on' catalyst.
I did manage an AUD JPY long 'risk on' trade on Wednesday. Which I ultimately closed pre NFP for small profit.
Not ideal, I'd much rather get back to an average of three trades per week. But nonetheless, after a disappointing June, it was nice to get back to winning ways of sorts.
All eyes on the tariff narrative as we move into the new week.

AUD/JPY: Rejection at Key ResistanceThis is a high-conviction short setup on AUD/JPY based on a powerful rejection pattern that has formed on the 4-hour chart. As you can see, the price spiked into the critical resistance zone between 95.00 and 95.55 but was immediately and forcefully rejected, leaving behind a long "Exhaustion Spike."
This is a classic sign of buyer exhaustion and seller dominance. It tells us that despite the recent rally, there is significant supply waiting at these higher levels. This price action provides a clear opportunity to short the pair in anticipation of a significant move down.
🏦 Fundamental Analysis
The fundamental backdrop provides a strong tailwind for this trade, with two key drivers:
1️⃣ Central Bank Divergence: The Reserve Bank of Australia (RBA) is in an easing cycle, having recently cut rates to 3.85% with more cuts expected. In stark contrast, the Bank of Japan (BoJ) is on a path of normalization, having already raised its rate to 0.50%. This divergence in monetary policy is structurally bearish for AUD/JPY.
2️⃣ Imminent Catalysts: This week is packed with event risk that is skewed to the downside for this pair. We have the RBA interest rate decision on Tuesday, July 8th , and the U.S. tariff deadline on Wednesday, July 9th . A dovish RBA or a "risk-off" move from the tariff news would likely accelerate the decline in AUD (a risk currency) and strengthen the JPY (a safe-haven currency).
📊 Technical Analysis
The price action on the chart confirms the bearish bias:
1️⃣ 4-Hour Rejection: The "Exhaustion Spike" at the 95.00 - 95.55 supply zone is the primary signal. It shows a clear failure by buyers and a strong takeover by sellers at a key level.
2️⃣ Long-Term Trend: On the daily chart, the price is trading below the critical 200-day moving average , confirming the long-term trend remains bearish.
3️⃣ Waning Momentum: There is a clear bearish divergence on the daily RSI. The price made a higher high, but the momentum indicator made a lower high, signaling that the rally is internally weak and losing steam.
📋 Trading Setup
This is a swing trade designed to capture a significant correction with a simple "set and forget" plan.
📉 Direction: SHORT / SELL
👉 Entry: Sell Limit @ 94.85
⛔️ Stop Loss: 95.60
🎯 Take Profit: 91.10
💡 Rationale: The entry is placed strategically to capitalize on a potential retest of the rejection area. The stop loss is placed safely above the rejection wick and the major resistance zone. The take profit targets the major structural support from the May 2025 lows, offering an excellent risk-to-reward ratio.

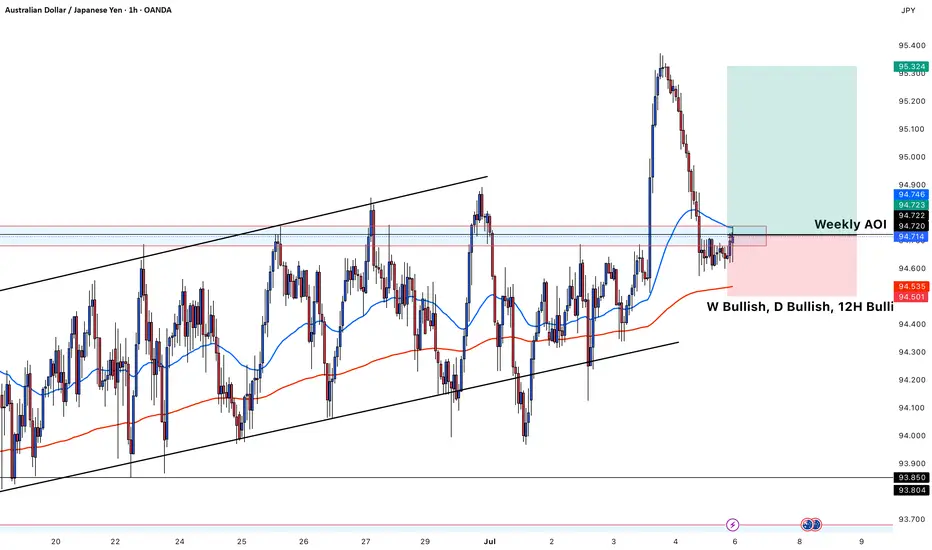
chart shows a Long setup on AUD/JPY based on multi-timeframeThis chart shows a **buy setup on AUD/JPY** based on multi-timeframe bullish confluence and a key structure level. Here's a breakdown of the idea:
---
### 🟢 **Trade Type:** Buy
### 📈 Pair: AUD/JPY (1H Chart)
---
### ✅ **Technical Confluences:**
* **Trend Bias:**
* **Weekly (W): Bullish**
* **Daily (D): Bullish**
* **12H: Bullish**
* **Structure:**
* Price retraced into a **Weekly Area of Interest (AOI)** marked in blue and red zone.
* It bounced off the lower trendline of the ascending channel.
* Price is currently forming higher lows near the support of the AOI.
* **Indicators:**
* The **50 EMA (blue)** and **200 EMA (red)** are holding as dynamic support, especially the 200 EMA just below current price.
* EMAs show bullish alignment (short-term EMA above long-term EMA).
* **Candle Action:**
* Price rejected the AOI and is trying to push higher.
* The bullish engulfing near the EMA zone confirms buy interest.
---
### 🟦 **Entry Zone:**
* Around **94.70–94.72**, aligned with the Weekly AOI and just above 200 EMA.
### 📍 Stop Loss:
* Below the red support zone, around **94.50–94.53**, under 200 EMA and key rejection wick.
### 🎯 Take Profit:
* Around **95.30–95.32**, targeting the previous swing high for a favorable risk-reward ratio.
---
### 📊 Summary:
This is a bullish continuation trade, buying from a retracement into a strong support zone with higher timeframe bullish structure and clear confirmation through price action and EMA alignment.
AUDJPY 4Hour TF - July 6th, 2025AUDJPY 7/6/2025
AUDJPY 4hour Neutral Idea
Monthly - Bullish
Weekly - Bearish
Dailly - Bearish
4hour - Ranging
We’re getting some mixed signals here on AJ so i’ll keep this as a neutral idea as we need more info from price action. Most of the major trends seem bearish but the 4hour trend seems to have some bullish pressure. Let’s see how this could play out this week:
Bullish Breakout - We already saw a pretty significant bullish attempt to break out of this range around 94.500. If we can spot some bullish conviction, now that we're retesting what seems to be a broken range, then we can confirm a bullish 4hour trend and prepare for potential long scenarios. I’ll be looking higher toward key resistance around 96.500 if this happens.
Bearish Breakout - For us to consider comfortable bearish scenarios, we would need to see price action fall back through our 94.500 zone and form a lower high. If we see structure formed below 94.500 we can begin targeting lower for potential short positions. Look toward key support levels as targets.

AUDJPY SHORT FORECAST Q3 W27 D4 Y25AUDJPY SHORT FORECAST Q3 W27 D4 Y25
Professional Risk Managers👋
Welcome back to another FRGNT chart update📈
Diving into some Forex setups using predominantly higher time frame order blocks alongside confirmation breaks of structure.
Let’s see what price action is telling us today! 👀
💡Here are some trade confluences📝
✅Weekly Order Block Identified
✅Daily Order block identified
✅4H Order Block identified
✅15' Order block identified
🔑 Remember, to participate in trading comes always with a degree of risk, therefore as professional risk managers it remains vital that we stick to our risk management plan as well as our trading strategies.
📈The rest, we leave to the balance of probabilities.
💡Fail to plan. Plan to fail.
🏆It has always been that simple.
❤️Good luck with your trading journey, I shall see you at the very top.
🎯Trade consistent, FRGNT X

AUD_JPY RISKY SHORT|
✅AUD_JPY is set to retest a
Strong resistance level above at 95.600
After trading in a local uptrend for some time
Which makes a bearish pullback a likely scenario
With the target being a local support below at 95.081
SHORT🔥
✅Like and subscribe to never miss a new idea!✅
Disclosure: I am part of Trade Nation's Influencer program and receive a monthly fee for using their TradingView charts in my analysis.

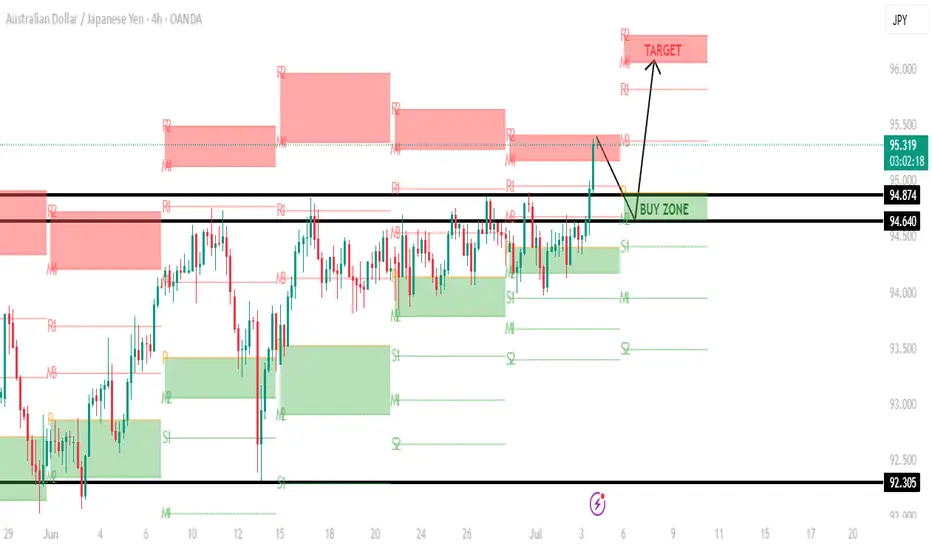
AUDJPY H4 LONG SETUPTECHNICAL ANALYSIS
This week AUDJPY broke out of the range to the upside. The price is currently at the weekly target. Given that it's Thursday and the end of the week is approaching, a possible take profit could occur from now until the end of Friday.
Support is at the previous resistance price level of 94.830, which is now the future buy zone. I will wait for the price to drop to this level before considering a long position.
FUNDAMENTAL ANALYSIS
Institutional traders are long JPY(79.46%) and Short AUD(80.47%) according to the COT data, which means long term it's possible to see a stronger JPY and weaker AUD.
Retail traders are short JPY(54%) and long AUD(46%). The strength meter is slightly tilted in favour of JPY strength.
Although institutional traders are long JPY, the technicals, however, show that a possible bullish trend is beginning, so while keeping that in mind, the current price and market direction are bullish in favour of AUD.

AUDJPY H4 LONG SETUPThis week AUDJPY broke out of the range to the upside. The price is currently at the weekly target. Given that it's Thursday and the end of the week is approaching, a possible take profit could occur from now until the end of Friday.
Support is at the previous resistance price level of 94.830, which is now the future buy zone. I will wait for the price to drop to this level before considering a long position.
AUDJPY: Short Trade Explained
AUDJPY
- Classic bearish formation
- Our team expects fall
SUGGESTED TRADE:
Swing Trade
Sell AUDJPY
Entry Level - 95.193
Sl - 95.477
Tp - 94.658
Our Risk - 1%
Start protection of your profits from lower levels
Disclosure: I am part of Trade Nation's Influencer program and receive a monthly fee for using their TradingView charts in my analysis.
❤️ Please, support our work with like & comment! ❤️