AUD_JPY LOCAL SHORT|
✅AUD_JPY made a retest of the
Strong horizontal resistance level of 94.800
And as you can see the pair is already
Making a local pullback from
The level which sends a clear
Bearish signal to us therefore
We will be expecting a
Further bearish correction
SHORT🔥
✅Like and subscribe to never miss a new idea!✅
Disclosure: I am part of Trade Nation's Influencer program and receive a monthly fee for using their TradingView charts in my analysis.
AUDJPY trade ideas

Watch what the market does . The market has hit a resistance and is supposed to sell from there . this is not a financial advise this is for educational purposes only
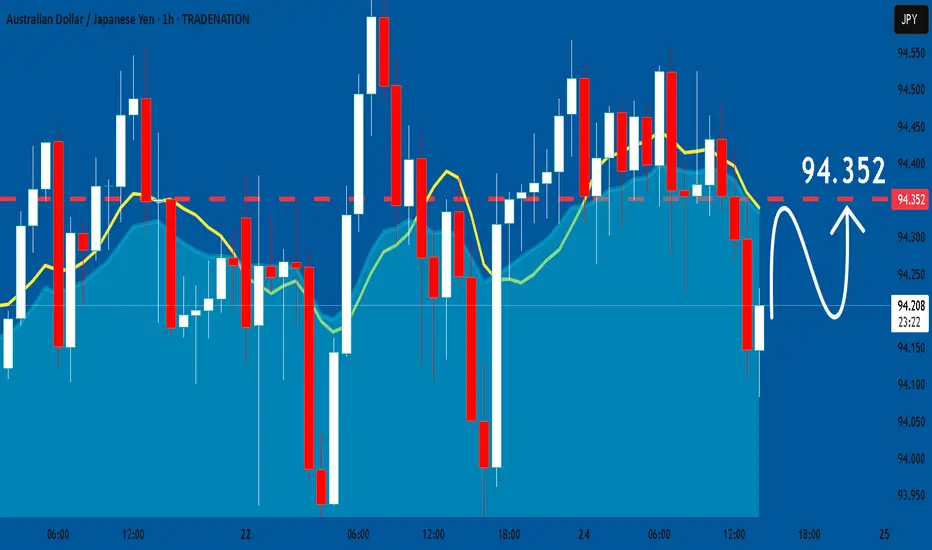
AUDJPY Under Pressure! SELL!
My dear subscribers,
This is my opinion on the AUDJPY next move:
The instrument tests an important psychological level 94.650
Bias - Bearish
Technical Indicators: Supper Trend gives a precise Bearish signal, while Pivot Point HL predicts price changes and potential reversals in the market.
Target - 94.434
About Used Indicators:
On the subsequent day, trading above the pivot point is thought to indicate ongoing bullish sentiment, while trading below the pivot point indicates bearish sentiment.
Disclosure: I am part of Trade Nation's Influencer program and receive a monthly fee for using their TradingView charts in my analysis.
———————————
WISH YOU ALL LUCK

AUDJPY DETAILED ANALYSISAUDJPY has successfully completed a breakout from a bullish pennant structure on the 4H timeframe, signaling the beginning of a strong upward continuation move. After a sustained consolidation below descending resistance, price action has now pierced through the upper trendline with volume and follow-through momentum. The breakout is aligned with the prior bullish leg from mid-June, indicating trend continuation. I’m now targeting 96.500 as the next key price level, with current price holding firm at 94.500.
Fundamentally, the Australian Dollar remains supported by recent hawkish RBA expectations. Traders are now pricing in the possibility of another rate hike following sticky inflation data out of Australia. The latest CPI print showed an annualized rise above 4%, exceeding forecasts, and reinforcing the case for tighter monetary policy. In contrast, the Japanese Yen continues to weaken as the Bank of Japan maintains its dovish tone, with no immediate signs of rate normalization. The ongoing yield divergence continues to fuel bullish flows into AUDJPY.
Today’s market sentiment favors risk-on assets, and AUD typically benefits in such conditions. Global equity strength and higher commodity prices are further backing AUD's upside momentum. Moreover, with carry trade flows increasing as investors seek higher-yielding currencies, AUDJPY is well-positioned to benefit from both fundamental tailwinds and technical breakout confirmation.
This setup is technically clean and fundamentally strong. Pullbacks toward the 94.100–93.900 zone could be retested as new support before the pair extends higher. As long as price holds above the breakout level, I remain bullish with 96.500 as my primary upside target. This pair is offering a high-probability continuation play in alignment with both macro and micro structure.

AUD/JPY at Risk of Breakdown as Bullish Momentum FadesAUD/JPY failed to follow through on a bullish breakout above 94.00, despite initial signs of strength from a bullish hammer and inverted H&S pattern. The pair has since printed a bearish engulfing candle on the daily chart to take prices near the lows of its range of the past week.
With the 1-hour RSI (2) hitting oversold levels, a minor bounce is possible, but risks remain skewed to the downside. A break beneath 93.70 would confirm a range breakdown and open the door to a deeper pullback towards the high-volume node (HVN) at 93.85.
Matt Simpson, Market Analyst at City Index and Forex.com.

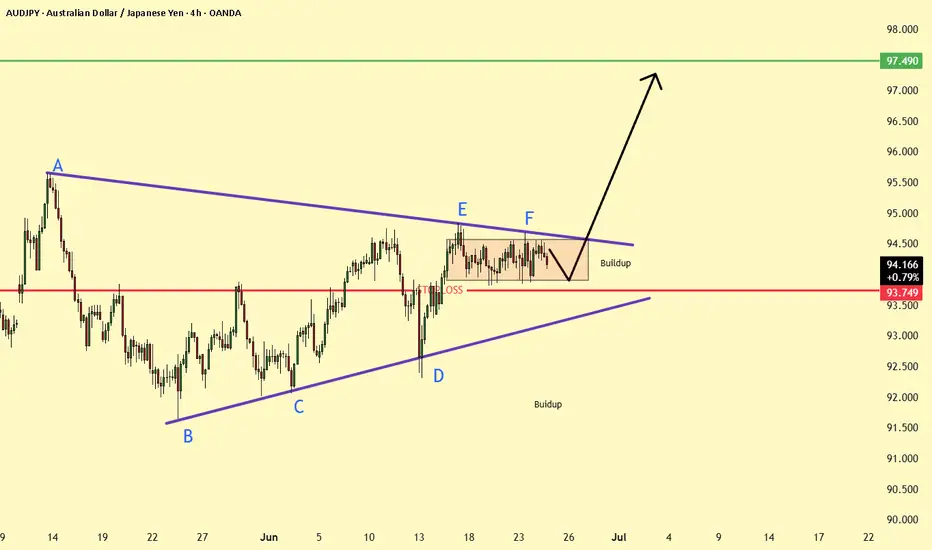
AUDJPY Buildup at Resistance ready for Breakout ?AUD/JPY is forming a symmetrical triangle, currently consolidating near the upper boundary. A successful retest of the support zone (~94.5) followed by strong bullish momentum could lead to a breakout toward 97.5. Watch for confirmation candles and volume spike for entry.
AUDJPY: Bulls Will Push Higher
The analysis of the AUDJPY chart clearly shows us that the pair is finally about to go up due to the rising pressure from the buyers.
Disclosure: I am part of Trade Nation's Influencer program and receive a monthly fee for using their TradingView charts in my analysis.
❤️ Please, support our work with like & comment! ❤️
AUDJPY SHORT FORECAST Q2 W26 D24 Y25AUDJPY SHORT FORECAST Q2 W26 D24 Y25
Professional Risk Managers👋
Welcome back to another FRGNT chart update📈
Diving into some Forex setups using predominantly higher time frame order blocks alongside confirmation breaks of structure.
Let’s see what price action is telling us today! 👀
💡Here are some trade confluences📝
✅Weekly Order Block Identified
✅Daily Order block identified
✅4H Order Block identified
✅15' Order block identified
🔑 Remember, to participate in trading comes always with a degree of risk, therefore as professional risk managers it remains vital that we stick to our risk management plan as well as our trading strategies.
📈The rest, we leave to the balance of probabilities.
💡Fail to plan. Plan to fail.
🏆It has always been that simple.
❤️Good luck with your trading journey, I shall see you at the very top.
🎯Trade consistent, FRGNT X

SELL AUDJPYSELL AUDJPY. Followed price up this rising trend line to the edge where price created a head and shoulders pattern.
Sell 94,5
TP 93,986 & 93,864
Structure Pattern: Cup and Handle (inverted)
Entry Model: Head and Shoulders

AUDJPY - Potential Short at the upper supply liquidity levelLooking for the potential short, only valid with bearish PA around the upper supply level, ideally sweeping the upper level of liquidity around 94.400-94.405. Bearish PA then bring this trade down.

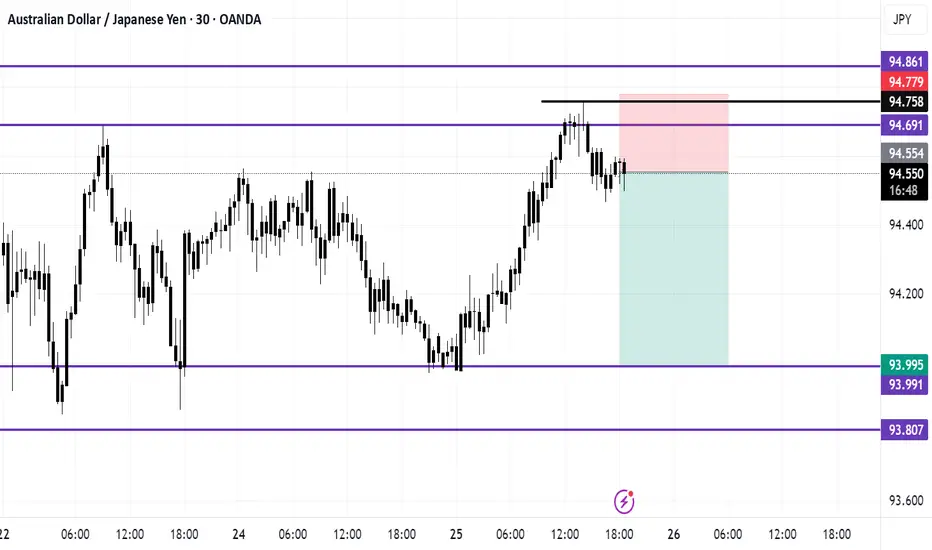
AUD/JPY SENDS CLEAR BEARISH SIGNALS|SHORT
Hello, Friends!
Previous week’s green candle means that for us the AUD/JPY pair is in the uptrend. And the current movement leg was also up but the resistance line will be hit soon and upper BB band proximity will signal an overbought condition so we will go for a counter-trend short trade with the target being at 93.835.
Disclosure: I am part of Trade Nation's Influencer program and receive a monthly fee for using their TradingView charts in my analysis.
✅LIKE AND COMMENT MY IDEAS✅

AUDJPY SHORT FORECAST Q2 W26 D23 Y25AUDJPY SHORT FORECAST Q2 W26 D23 Y25
Professional Risk Managers👋
Welcome back to another FRGNT chart update📈
Diving into some Forex setups using predominantly higher time frame order blocks alongside confirmation breaks of structure.
Let’s see what price action is telling us today! 👀
💡Here are some trade confluences📝
✅Weekly Order Block Identified
✅Daily Order block identified
✅4H Order Block identified
✅15' Order block identified
🔑 Remember, to participate in trading comes always with a degree of risk, therefore as professional risk managers it remains vital that we stick to our risk management plan as well as our trading strategies.
📈The rest, we leave to the balance of probabilities.
💡Fail to plan. Plan to fail.
🏆It has always been that simple.
❤️Good luck with your trading journey, I shall see you at the very top.
🎯Trade consistent, FRGNT X

Trendline BreakThe price has been correcting within a trendline and now the price has broken the trendline and made a pullback, if the price makes a higher high, we will see an impulse to the upside
WE ONLY TRADE PULLBACKS

AUDJPY daily/ weekly cp wow 📈 AUDJPY Swing Trade Setup
🔹 Buy Limit: At Weekly/Daily Demand Zone
🔹 Bias: Bullish (COT-supported)
🔹 Reason:
Price is sitting inside a key weekly/daily demand zone, offering a strong long opportunity.
COT report shows commercials (smart money) are net long AUD and speculators are net short, indicating potential for a reversal or continued upside.
Aligns with the Set & Forget swing strategy — no confirmation needed.
📊 Structure supports a clean risk-to-reward setup with confluence from both technicals and sentiment.

AUD/JPY Short Trade Plan Options
✅ Standard Entry
Sell Limit: 94.80
Stop Loss: 96.10
Take Profit 1: 90.00
Take Profit 2: 85.00
Why: Clean entry inside rejection zone, just under multi-decade resistance. Gives room for price to wick higher without being stopped prematurely.
🛡️ Conservative Entry
Sell Limit: 95.20
Stop Loss: 96.30
Take Profit 1: 90.00
Take Profit 2: 85.00
Why: Waits for deeper retracement into top of range. Better R:R, but may not trigger if price weakens early in the week.
🔐 Optional Manual Confirmation Strategy
Watch for a bearish daily candle (pin bar, engulfing) inside 94.50–95.50
Enter at close of that candle with stop above candle high
Gives added confirmation but may reduce reward slightly

AUDJPY: Sell opportunity.AUDJPY is basically neutral on its 1D technical outlook (RSI = 56.422, MACD = 0.430, ADX = 19.989), ranging inside the 1D MA200 and 1D MA50 since the start of May. The last bullish wave top of the Channel Down got rejected around those levels and targeted the S1 Zone. Short, TP = 90.150.
## If you like our free content follow our profile to get more daily ideas. ##
## Comments and likes are greatly appreciated. ##

AUDJPY SHORT FORECAST Q2 W25 D20 Y25AUDJPY SHORT FORECAST Q2 W25 D20 Y25
Professional Risk Managers👋
Welcome back to another FRGNT chart update📈
Diving into some Forex setups using predominantly higher time frame order blocks alongside confirmation breaks of structure.
Let’s see what price action is telling us today! 👀
💡Here are some trade confluences📝
✅Weekly Order block rejection
✅15' Order block to be confirmed
✅4H Order block
✅1H Order block
🔑 Remember, to participate in trading comes always with a degree of risk, therefore as professional risk managers it remains vital that we stick to our risk management plan as well as our trading strategies.
📈The rest, we leave to the balance of probabilities.
💡Fail to plan. Plan to fail.
🏆It has always been that simple.
❤️Good luck with your trading journey, I shall see you at the very top.
🎯Trade consistent, FRGNT X

AUD_JPY GROWTH AHEAD|LONG|
✅AUD_JPY has retested a key support level of 93.800
And as the pair is already making a bullish rebound
A move up to retest the supply level above at 94.600 is likely
LONG🚀
✅Like and subscribe to never miss a new idea!✅
Disclosure: I am part of Trade Nation's Influencer program and receive a monthly fee for using their TradingView charts in my analysis.

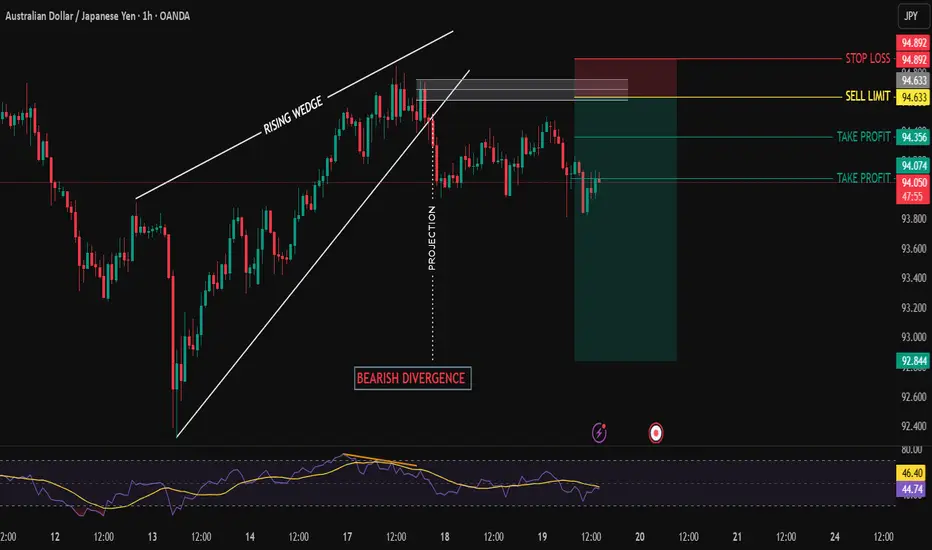
AUDJPY BEARSH SETUPAUDJPY bearish trend start.
At rsi bearish divergence and also reversal pattern rising wedge formed, also HL already break.
My entry was missed with sell stop order.
I was expecting price go up this fib level then go down.
Manage your trade accordingly.


Markets in Motion: Fed, Geopolitics, and the Next Big Move This week’s midweek market review dives into the critical catalysts shaking global markets—just ahead of the pivotal FOMC decision.
📉 Is the U.S. dollar heading for a deeper slide?
🏆 Will gold break past its all-time highs again?
₿ Can Bitcoin sustain momentum amid geopolitical risk and Fed uncertainty?
We unpack:
Key economic data driving DXY
Gold’s safe-haven surge and central bank demand
Bitcoin’s resilience, ETF flows, and macro headwinds
Geopolitical flashpoints in the Middle East and their market implications
Stay ahead of the curve with real-time insights to help you navigate the markets confidently into the weekend and beyond.
🔔 Don’t forget to like, subscribe, and hit the bell to stay updated with our weekly outlooks!

SHORT ON AUD/JPYAUD/JPY has given us a choc (change of character) from up to down at a major resistance zone.
I will be selling AUD/JPY to the next demand level looking to catch 100-200 pips
