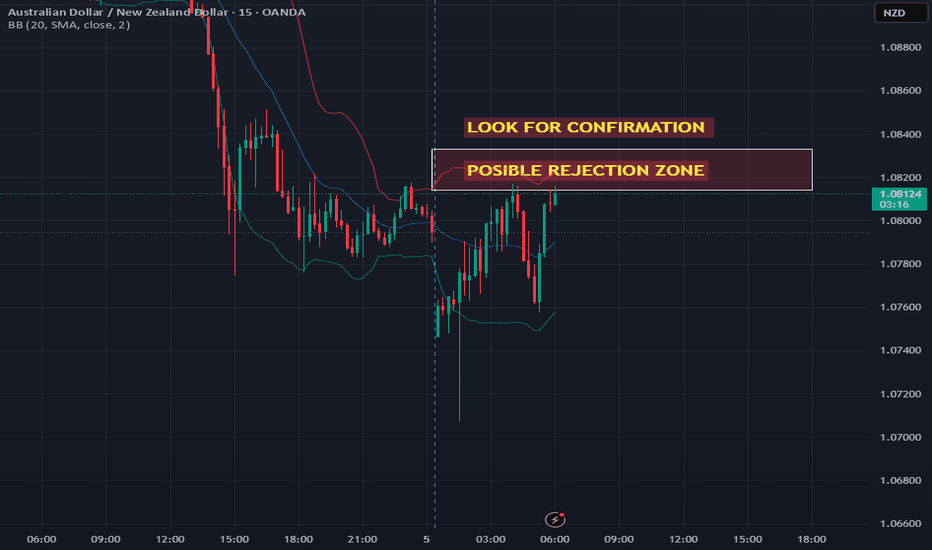
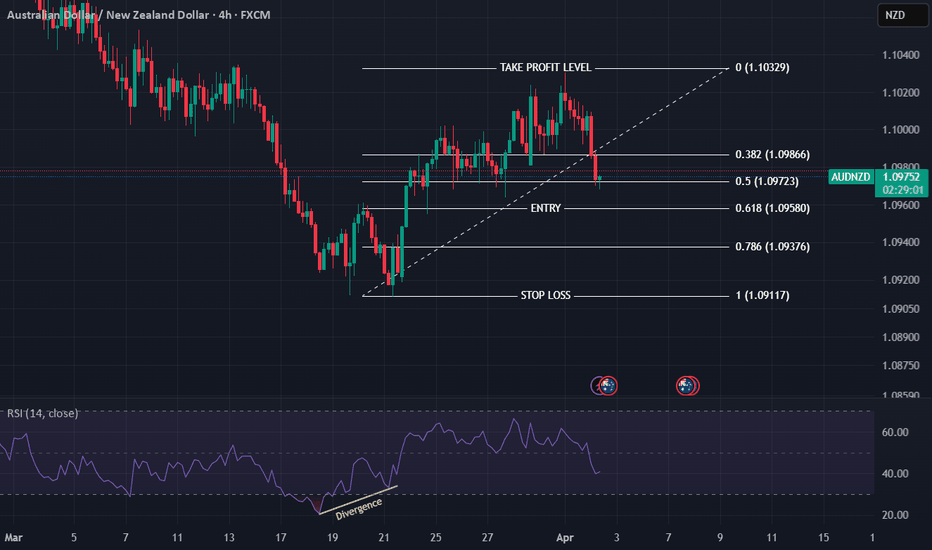
AUDNZD trade ideas
Bearish reversal?AUD/NZD is rising towards the pivot and could reverse to the 1st support.
Pivot: 1.09400
1st Support: 1.08854
1st Resistance: 1.10183
Risk Warning:
Trading Forex and CFDs carries a high level of risk to your capital and you should only trade with money you can afford to lose. Trading Forex and CFDs may not be suitable for all investors, so please ensure that you fully understand the risks involved and seek independent advice if necessary.
Disclaimer:
The above opinions given constitute general market commentary, and do not constitute the opinion or advice of IC Markets or any form of personal or investment advice.
Any opinions, news, research, analyses, prices, other information, or links to third-party sites contained on this website are provided on an "as-is" basis, are intended only to be informative, is not an advice nor a recommendation, nor research, or a record of our trading prices, or an offer of, or solicitation for a transaction in any financial instrument and thus should not be treated as such. The information provided does not involve any specific investment objectives, financial situation and needs of any specific person who may receive it. Please be aware, that past performance is not a reliable indicator of future performance and/or results. Past Performance or Forward-looking scenarios based upon the reasonable beliefs of the third-party provider are not a guarantee of future performance. Actual results may differ materially from those anticipated in forward-looking or past performance statements. IC Markets makes no representation or warranty and assumes no liability as to the accuracy or completeness of the information provided, nor any loss arising from any investment based on a recommendation, forecast or any information supplied by any third-party.
AUD_NZD POTENTIAL SHORT|
✅AUD_NZD is going up now
But a strong resistance level is ahead at 1.094
Thus I am expecting a pullback
And a move down towards the target at 1.086
SHORT🔥
✅Like and subscribe to never miss a new idea!✅
Disclosure: I am part of Trade Nation's Influencer program and receive a monthly fee for using their TradingView charts in my analysis.
AUD/NZD NEXT MOVESell after bearish candle stick pattern, buy after bullish candle stick pattern....
Best bullish pattern , engulfing candle or green hammer
Best bearish pattern , engulfing candle or red shooting star
NOTE: IF YOU CAN'T SEE ANY OF TOP PATTERN IN THE ZONE DO NOT ENTER
Stop lost before pattern
R/R %1/%3
Trade in 5 Min Timeframe, use signals for scalping
AUDNZD Forecast: Strong AI-backed Signal Points to UpsideThe EASY Trading AI model delivers a clear buy signal for AUDNZD at the entry price of 1.07909. This bullish sentiment emerges from enhanced momentum metrics and positive price-action signals underscored by the strategy’s predictive algorithms. We anticipate upward movement towards our target of 1.08707667. Strict risk management suggests placing Stop Loss at 1.07067667, protecting our trade against unexpected volatility and downside reversals.Current technical alignment and algorithmic indicators strongly reinforce buying strength, confirming potential gains in the short-term horizon. Stay disciplined with your trading plan and observe position carefully.
AUD/NZD NEXT MOVESell after bearish candle stick pattern, buy after bullish candle stick pattern....
Best bullish pattern , engulfing candle or green hammer
Best bearish pattern , engulfing candle or red shooting star
NOTE: IF YOU CAN'T SEE ANY OF TOP PATTERN IN THE ZONE DO NOT ENTER
Stop lost before pattern
R/R %1/%3
Trade in 5 Min Timeframe, use signals for scalping
AUD-NZD Massive Long! Buy!
Hello,Traders!
AUD-NZD has also fallen
Down by a lot last week
And we think that the
Initial panic move is over
So as the pair is oversold
And is about to retest a
Horizontal support of 1.0740
A strong bullish correction
Is to be expected on Monday
Buy!
Comment and subscribe to help us grow!
Check out other forecasts below too!
Disclosure: I am part of Trade Nation's Influencer program and receive a monthly fee for using their TradingView charts in my analysis.
AUD/NZD "Aussie-Kiwi" Forex Bank Heist Plan (Swing/Day)🌟Hi! Hola! Ola! Bonjour! Hallo! Marhaba!🌟
Dear Money Makers & Robbers, 🤑 💰💸✈️
Based on 🔥Thief Trading style technical and fundamental analysis🔥, here is our master plan to heist the AUD/NZD "Aussie-Kiwi" Forex Bank. Please adhere to the strategy I've outlined in the chart, which emphasizes long entry. Our aim is the high-risk ATR Red Zone. It's Risky level, overbought market, consolidation, trend reversal, trap at the level where traders and bearish robbers are stronger. 🏆💸"Take profit and treat yourself, traders. You deserve it!💪🏆🎉
Entry 📈 : "The heist is on! Wait for the MA breakout then make your move - Bullish profits await!"
however I advise to Place Buy stop orders above the Moving average 1.10400 (or) Place buy limit orders within a 15 or 30 minute timeframe most recent or swing, low or high level.
📌I strongly advise you to set an "alert (Alarm)" on your chart so you can see when the breakout entry occurs.
Stop Loss 🛑:
Thief SL placed at the nearest / swing low level Using the 4H timeframe (1.09700) Day / swing trade basis.
SL is based on your risk of the trade, lot size and how many multiple orders you have to take.
🏴☠️Target 🎯: 1.11700 (or) Escape Before the Target
🧲Scalpers, take note 👀 : only scalp on the Long side. If you have a lot of money, you can go straight away; if not, you can join swing traders and carry out the robbery plan. Use trailing SL to safeguard your money 💰.
💵💰AUD/NZD "Aussie-Kiwi" Forex Bank Heist Plan (Swing / Day Trade) is currently experiencing a bullishness,., driven by several key factors.
📰🗞️Get & Read the Fundamental, Macro, COT Report, Quantitative Analysis, Sentimental Outlook, Intermarket Analysis, Future trend targets.... go ahead to check 👉👉👉🔗
⚠️Trading Alert : News Releases and Position Management 📰 🗞️ 🚫🚏
As a reminder, news releases can have a significant impact on market prices and volatility. To minimize potential losses and protect your running positions,
we recommend the following:
Avoid taking new trades during news releases
Use trailing stop-loss orders to protect your running positions and lock in profits
💖Supporting our robbery plan 💥Hit the Boost Button💥 will enable us to effortlessly make and steal money 💰💵. Boost the strength of our robbery team. Every day in this market make money with ease by using the Thief Trading Style.🏆💪🤝❤️🎉🚀
I'll see you soon with another heist plan, so stay tuned 🤑🐱👤🤗🤩
AUD_NZD SWING LONG|
✅AUD_NZD is about to retest a key structure level of 1.0750
Which implies a high likelihood of a move up
As some market participants will be taking profit from short positions
While others will find this price level to be good for buying
So as usual we will have a chance to ride the wave of a bullish correction
LONG🚀
✅Like and subscribe to never miss a new idea!✅
Disclosure: I am part of Trade Nation's Influencer program and receive a monthly fee for using their TradingView charts in my analysis.
AUDNZD Short Opportunity Based on EASY Trading AI StrategyToday's analysis using the EASY Trading AI strategy indicates a bearish outlook for the AUDNZD pair. I'm entering a Sell position at 1.09516, targeting a profit at 1.09263333, while carefully placing my Stop Loss at 1.09949333. The decision relies on the system's detection of weakening bullish momentum and technical signals pointing to increased selling pressure. Given the recent price action showing exhaustion from buyers, a correction downward seems plausible. Traders following similar strategies could capitalize on this near-term bearish setup, maintaining prudent risk management in volatile sessions.
AUDNZD Buy OANDA:AUDNZD
The forex trading signals provided are for informational and educational purposes only and do not constitute financial, investment, or trading advice. Trading foreign exchange (forex) involves significant risk, and past performance does not guarantee future results.
By using these signals, you acknowledge and agree that:
1. No Guarantees: There are no guarantees of profit or success. Market conditions can change rapidly, and trading decisions should be made with careful analysis and risk management.
2. Own Responsibility: You assume full responsibility for your trading decisions. We are not liable for any losses incurred from following our signals.
3. Risk Warning: Forex trading is highly speculative and can result in substantial losses, including the loss of all invested capital. You should only trade with money you can afford to lose.
4. Independent Decision-Making: It is strongly recommended that you conduct your own research, seek professional financial advice, and use risk management strategies before executing any trades.
5. No Client-Advisor Relationship: Our signals do not establish a client-advisor relationship. We are not acting as your financial advisor or fiduciary.
AUD/NZD Testing Area of Confluence; Further Selling?Following the pullback from lows of N$1.0903 on 20 March in the AUD/NZD cross (Australian dollar versus the New Zealand dollar) – a move that also completed a longer-term double-top pattern at N$1.1180 – buyers and sellers on the daily chart are squaring off at resistance from N$1.1002. Complementing this area is a trendline that has turned from support to resistance (from the low of N$1.0564), and a 38.2% Fibonacci retracement level at N$1.1008.
FXAN & Heikin Ashi Trade IdeaOANDA:AUDNZD
In this video, I’ll be sharing my analysis of AUDNZD, using FXAN's proprietary algo indicators with my unique Heikin Ashi strategy. I’ll walk you through the reasoning behind my trade setup and highlight key areas where I’m anticipating potential opportunities.
I’m always happy to receive any feedback.
Like, share and comment! ❤️
Thank you for watching my videos! 🙏
SHORT ON AUD/NZDAUD/NZD has given a perfect setup for a sell.
I has bearish divergence as well as a rising channel/wedge into a Major Supply Area from the Higher TF.
We have also change structure from Up to Down on the Lower Timeframe.
I will be selling AUD/NZD to the pervious swing low / demand area for about 100 pips. OANDA:AUDNZD
AUDJPY FORECASTGuys! the market has opened with a very good and clean structures! This week looks stunning and impressing as well. What we only need is to be patient waiting for the market to give us a clear picture of what is going to do next! AUDNZD is looking clearer let's watch it with a close eye today and see actually how the market is going to develop!


