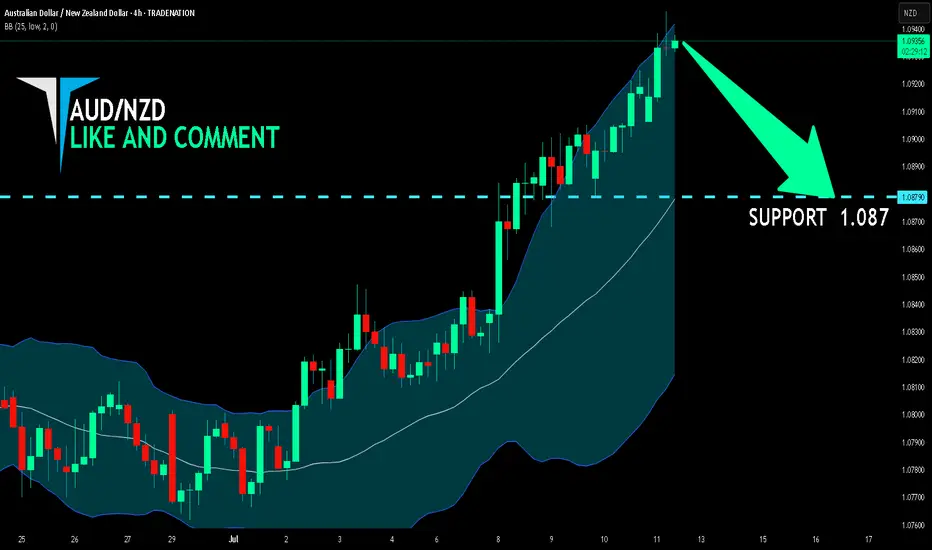
AUD/NZD SHORT FROM RESISTANCE
Hello, Friends!
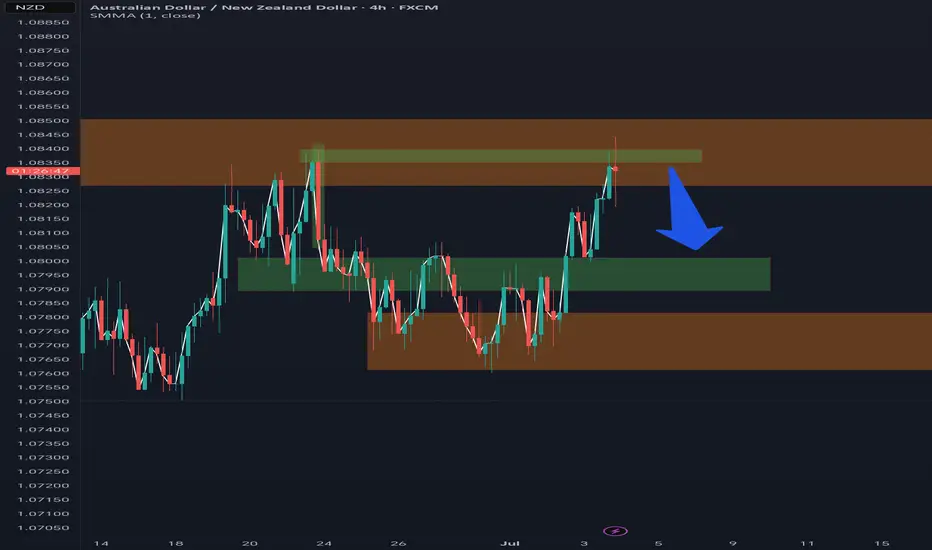
AUD/NZD pair is in the downtrend because previous week’s candle is red, while the price is clearly rising on the 4H timeframe. And after the retest of the resistance line above I believe we will see a move down towards the target below at 1.087 because the pair is overbought due to its proximity to the upper BB band and a bearish correction is likely.
Disclosure: I am part of Trade Nation's Influencer program and receive a monthly fee for using their TradingView charts in my analysis.
✅LIKE AND COMMENT MY IDEAS✅
AUDNZD trade ideas
AUDNZD LongAUDNZD is now net long, and this is it's first break in months.
I am reviewing all AUD pairs.
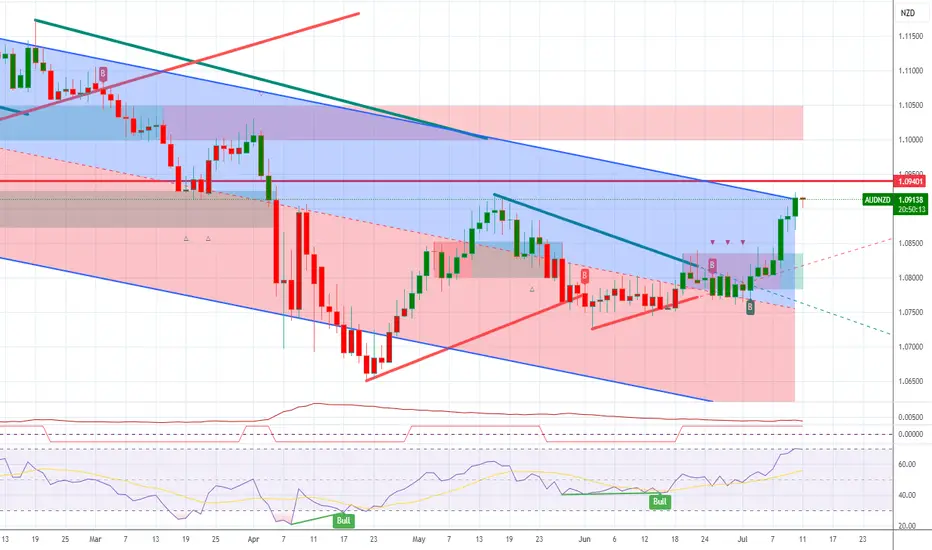
AUD-NZD Short From Resistance! Sell!
Hello,Traders!
AUD-NZD keeps growing
And the pair is overbought
So after it hits the horizontal
Resistance of 1.0921 from
Where we will be expecting
A local bearish correction
Sell!
Comment and subscribe to help us grow!
Check out other forecasts below too!
Disclosure: I am part of Trade Nation's Influencer program and receive a monthly fee for using their TradingView charts in my analysis.

Congratulations to those of us that took this trade Congratulations to those of us that took this trade

AUD_NZD SWING SHORT|
✅AUD_NZD has been growing recently
And the pair seems locally overbought
So as the pair is approaching a horizontal resistance of 1.0920
Price decline is to be expected
SHORT🔥
✅Like and subscribe to never miss a new idea!✅
Disclosure: I am part of Trade Nation's Influencer program and receive a monthly fee for using their TradingView charts in my analysis.

AUDNZD; Heikin Ashi Trade IdeaOANDA:AUDNZD
In this video, I’ll be sharing my analysis of AUDNZD, using FXAN's proprietary algo indicators with my unique Heikin Ashi strategy. I’ll walk you through the reasoning behind my trade setup and highlight key areas where I’m anticipating potential opportunities.
I’m always happy to receive any feedback.
Like, share and comment! ❤️
Thank you for watching my videos! 🙏

Potential downward move from trendine-ForexBDIn the H4 timeframe of AUDNZD, the price is in an uptrend, but there is a possibility that the market might change its movement upon reaching the trendline, potentially shifting to a downtrend.
You can please share your opinion.
⭕️Risk Warning : Trading on financial markets carries risks!
©FXBD Official Team

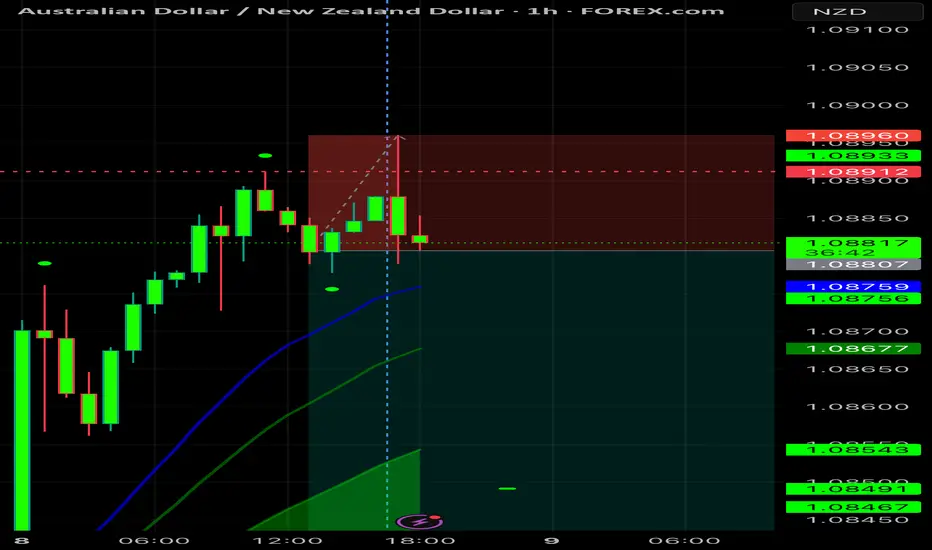
AUDNZD Looks Bullish – 1.0870 in SightI believe AUD/NZD is currently showing bullish signs and could continue to move higher. The price seems to be gaining strength, and I expect it to reach the 1.0870 level soon, which is about 50 pips above the current price. If the upward momentum continues, this target could be hit soon.

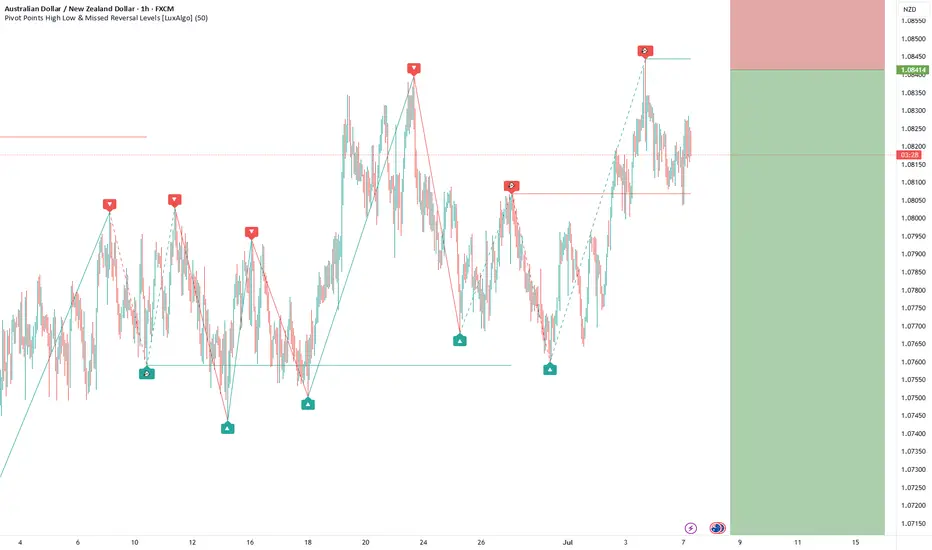
AUDNZD Breakout Retest – Ready for the Next Bullish Leg?
AUDNZD has broken out of a prolonged consolidation box, supported by a demand zone below. Price is currently retesting the breakout level, which often acts as a launchpad for the next move.
🧠 Key Observations:
🔷 Consolidation Breakout – Price cleanly broke above the consolidation range.
🔁 Retest in Progress – A potential bullish retest is unfolding at 1.0800 area.
🟦 Demand Zone below offers strong support around 1.0730–1.0750.
🎯 Target: 1.08750 (pre-identified resistance zone)
----------
📌 Trade Plan:
🎯 Take Profit (TP): 1.0875
🛑 Stop Loss (SL): Below 1.0750 demand zone
🧭 Bias: Bullish
📊 Strategy: Breakout–Retest–Rally

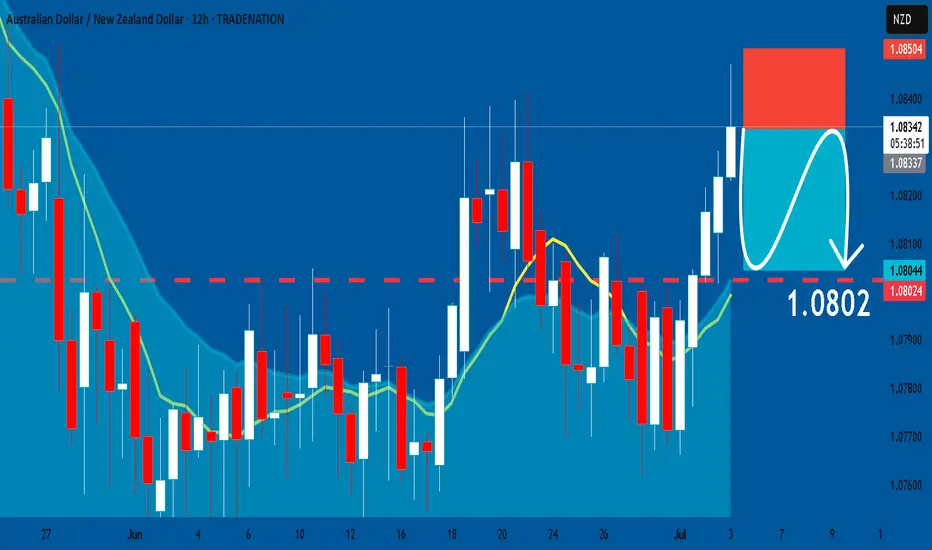
AUDNZD: Short Trade Explained
AUDNZD
- Classic bearish formation
- Our team expects pullback
SUGGESTED TRADE:
Swing Trade
Short AUDNZD
Entry - 1.0834
Sl - 1.0850
Tp - 1.0801
Our Risk - 1%
Start protection of your profits from lower levels
Disclosure: I am part of Trade Nation's Influencer program and receive a monthly fee for using their TradingView charts in my analysis.
❤️ Please, support our work with like & comment! ❤️

I’m short AUDNZD.⚠️ AUD looks strong — but I’m short AUDNZD.
China’s bounce helps Aussie for now, but cracks are showing: weak CPI, soft PMI, and looming rate cuts.
🧊 NZD’s not exciting, but it’s stable — and that’s enough when AUD’s running on fumes.
This pair’s climbing a shaky ladder. I’m betting it slips.
📉 Would you short it too?
BUY AUDNZD now for a four hour time frame bullish trend continuBUY AUDNZD now for a four hour time frame bullish trend continuation ...............
STOP LOSS: 1.0815
This buy trade setup is based on hidden bullish divergence trend continuation trading pattern ...
Always remember, the trend is your friend, so whenever you can get a signal that the trend will continue, then good for you to be part of it
TAKE PROFIT : take profit will be when the trend comes to an end, feel from to send me a direct DM if you have any question about take profit or anything...
Remember to risk only what you are comfortable with... trading with the trend, patient and good risk management is the key to success here

AUDNZD still bullish here
OANDA:AUDNZD second analysis on this pair. We have strong zones visible/created, DESCENDING CHANNEL breaked, from first analysis bullish here and still for new week bullish view having.
SUP zone: 1.08000
RES zone: 1.08850, 1.09250

AUD-NZD Local Long! Buy!
Hello,Traders!
AUD-NZD is already making
A bullish rebound from the
Horizontal support of 1.0810
So we are locally bullish biased
And we will be expecting a
Further bullish move up
Buy!
Comment and subscribe to help us grow!
Check out other forecasts below too!
Disclosure: I am part of Trade Nation's Influencer program and receive a monthly fee for using their TradingView charts in my analysis.

AUD_NZD WILL GROW|LONG|
✅AUD_NZD made a bullish
Rebound so we are bullish
Biased and we will be expecting
A further bullish move up
LONG🚀
✅Like and subscribe to never miss a new idea!✅
Disclosure: I am part of Trade Nation's Influencer program and receive a monthly fee for using their TradingView charts in my analysis.

Sell Area My prediction for AudNzd sell now because have a bearish engulfing timeframe H4 at the same daily zone for resistance.
Tq for support 😄💸
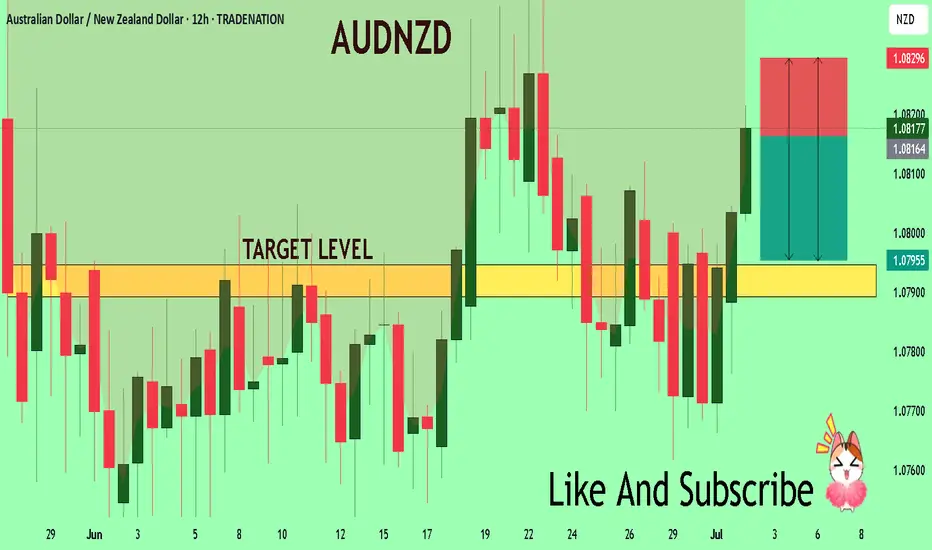
AUDNZD: Short Trading Opportunity
AUDNZD
- Classic bearish setup
- Our team expects bearish continuation
SUGGESTED TRADE:
Swing Trade
Short AUDNZD
Entry Point - 1.0834
Stop Loss - 1.0850
Take Profit - 1.0802
Our Risk - 1%
Start protection of your profits from lower levels
Disclosure: I am part of Trade Nation's Influencer program and receive a monthly fee for using their TradingView charts in my analysis.
❤️ Please, support our work with like & comment! ❤️
AUD_NZD LOCAL LONG|
✅AUD_NZD made a retest
And a bullish rebound from
The horizontal support level
Around 1.0805 so we are
Locally bullish biased and we
Will be expecting a further
Bullish move up
LONG🚀
✅Like and subscribe to never miss a new idea!✅
Disclosure: I am part of Trade Nation's Influencer program and receive a monthly fee for using their TradingView charts in my analysis.

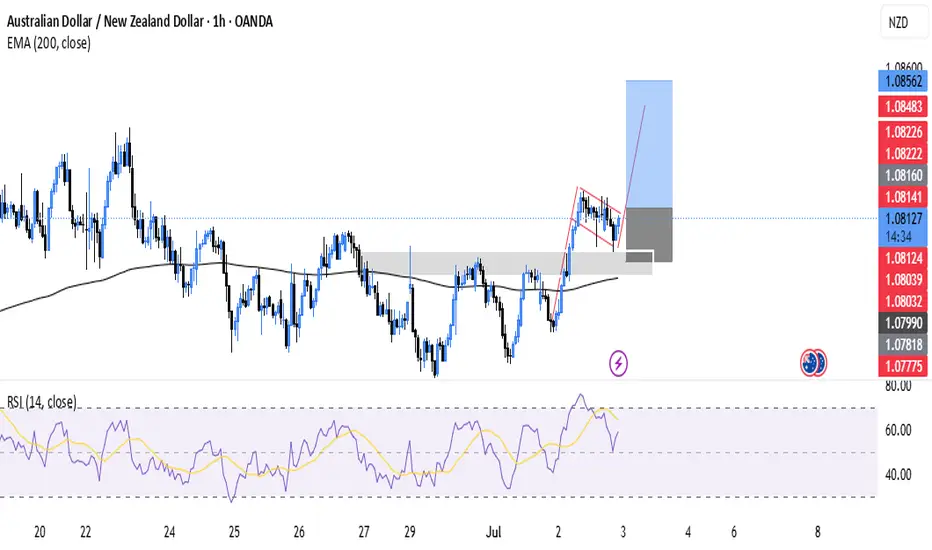
AUDNZDBULLISH FLAGTechnically:
AUDNZD printing bullish flag
AUDNZD retest the resistance area which now became support
AUDNZD break the 200 EMA strongly then retest
AUDNZD Will Collapse! SELL!
My dear friends,
Please, find my technical outlook for AUDNZD below:
The price is coiling around a solid key level - 1.0816
Bias - Bearish
Technical Indicators: Pivot Points Low anticipates a potential price reversal.
Super trend shows a clear sell, giving a perfect indicators' convergence.
Goal - 1.0794
Safe Stop Loss - 1.0829
About Used Indicators:
The pivot point itself is simply the average of the high, low and closing prices from the previous trading day.
Disclosure: I am part of Trade Nation's Influencer program and receive a monthly fee for using their TradingView charts in my analysis.
———————————
WISH YOU ALL LUCK
AUDNZD The Target Is DOWN! SELL!
My dear subscribers,
AUDNZD looks like it will make a good move, and here are the details:
The market is trading on 1.0817 pivot level.
Bias - Bearish
Technical Indicators: Both Super Trend & Pivot HL indicate a highly probable Bearish continuation.
Target - 1.0798
About Used Indicators:
The average true range (ATR) plays an important role in 'Supertrend' as the indicator uses ATR to calculate its value. The ATR indicator signals the degree of price volatility.
Disclosure: I am part of Trade Nation's Influencer program and receive a monthly fee for using their TradingView charts in my analysis.
———————————
WISH YOU ALL LUCK

AUDNZDH4 double bottom off the daily support. Looking for longs only if price retests the neckline and gives bullish signals
